JavaScript must be enabled in order for you to use the Site in standard view. However, it seems JavaScript is either disabled or not supported by your browser. To use standard view, enable JavaScript by changing your browser options.

| Last Updated:: 16/04/2025

Industry


Department: In Kerala,the department of industies and commerce is headed by a Principal Secretary to Government. This department is responsible for promoting/ sponsoring, registering, financing and advising industries in the state. The department and its agencies also guide the entrepreneurs in the selection of appropriate industrial ranges in the private, public, joint and co-operative sectors. Directorates of industries and Commerce, Handloom and Textiles, Coir Development, Mining and Geology and 72 Public Sector undertakings fall under this department. Visit Kerala's position is 12th in the industrial ranking among the major 16 States in India . It was reported that about 22.5 % of the total income of the State came from the secondary sector during 1980-81, which was only 17% during 1970-71. The industrial sector of Kerala employed 15% of the total workers against the national average of 9%.


Industrial Growth Centres:As per scheme announced by the Central Government, Government of Kerala has entrusted Kerala State Industrial Development Corporation Ltd (KSIDC) for developing and managing Industrial Growth Centres in various locations in the state. Accordingly KSIDC has acquired /purchased land at four industrially backward locations in the following districts:

 1.Kannur  - Valiyavelicham (Kuthupramba)

2.Kozhikode - Kinalur (Balusserry)

3.Malappuram - Panakkad (Malappuram)

4.Alappuzha - Pallippuram (Cherthala)


             The Industrial Growth Centres at the above locations are under various stages of development and basic infrastructural facilities such as road, water, power, telecommunication etc are already put in place. Steps are being taken to improve the facilities further.Industrial plots are available at these Growth Centres and entrepreneurs can get the same for setting up industrial units, on long lease for a period of ninety years. The units coming up in the IGC are supported by Single Window Clearance Mechanism of State Govt.


Major Industrial Locations: Most of the industrial and commercial establishments in Kerala are concentrated in the coastal zone.Among the coastal districts, Ernakulam and Trivandrum have fairly large number of industries along the coast, followed by Alappuzha, Kollam, Kozhikode , Kannur, Kasargod and Malapuram. Eloor- Edayar- Ambalamugal area is the major industrial area located in the coastal zone in the city of Kochi in Ernakulam District along the banks of the Cochin backwaters.


Major Industries such as

  • Fertilizer and Chemicals Travancore Ltd.(FACT)
  • Kochi Refineries Ltd.(KRL)
  • Hindustan Organic Chemicals (HOC)
  •  Cominco Binani and Cochin Shipyard are located in Kochi availing the advantage of the port facilities.

          The world famous Chavara placer deposits of the Kollam district support three major mineral industries in Kerala viz.

  • The Indian Rare Earths Ltd. (IRE) 
  • Kerala Minerals and Metals Ltd.(KMML) at Chavara (Kollam)
  • The Travancore Titanium Products (TTP) at Veli (Trivandrum).


            These units are situated closer to the sea. The Excel Glass factory situated near Cherthala utilizes the silica sands of the coastal zone of Alappuzha district for the manufacture of glass. Most of the seafood and coir industries in Kerala are located in the coastal area and are concentrated in Alappuzha district. There are 101 seafood factories in the coastal zone with a freezing capacity of approximately 1868 t /day, of which 47 are approved by the European Union. Besides, there are 210 peeling sheds and 217 ice plants. Cashew processing industries, a traditional enterprise in the state are mainly situated in the coastal area of Kollam district.There are about 300 large and medium scale industries and 1,66,000 small scale industries, most of them are located in the coastal area (KSPCB, 20002). Of these 250 large and medium scale industries and 5000 small scale industries are polluting significantly to the environment.   


District-wise break up of Medium and Large Scale Industries in Kerala as on 31-03-2007


Map of Kerala showing important Fishing Harbors & Ports 


Industrial sector in Kerala


                        Industrial sector in Kerala comprises medium and large industries, micro, small and medium enterprises (MSME) and traditional industries. The departments/agencies that deal with medium and large industries are Kerala State Industrial Development Corporation Ltd (KSIDC), Kerala Industrial Infrastructure Development Corporation (KINFRA), Public Sector Restructuring and Internal Audit Board (RIAB), Bureau of Public Enterprises (BPE) and Centre for Management Development (CMD). The agencies dealing with MSME and traditional industries are Department of Industries and Commerce, Directorate of Hand loom and Textiles, Directorate of Coir Development, Khadi and Village Industries Board and Capex. Department of Mining and Geology also comes under this sector.


 Micro Small and Medium Enterprises (MSMEs)


                     Micro, Small and Medium Enterprises (MSME) play a significant role in the economic development of a country. MSMEs are strong drivers of employment generation and economic development in India. The Government of Kerala assigns priority to the sector realising its potential to generate employment, and thereby contribute to economic growth. In addition, the sector can add to export growth. The sector plays a critical role in promoting innovation and ensuring sustainable development, equitable growth, and the utilisation of natural resources.


                    The 73rd round of NSS reported 633.88 lakh unincorporated non-agricultural MSMEs engaged in different activities in India, of which, 31 per cent MSMEs were engaged in manufacturing activities, 32 per cent in trade and 33 per cent in other services (196.65 lakh in manufacturing, 230.35 lakh in trade, 206.85 lakh in other services and 0.03 lakh in non-captive electricity generation and transmission) Excluding those registered under “(a) Sections 2m(i) and 2m(ii) of the Factories Act, 1948, (b) Companies Act, 1956 and (c) Construction activities falling under Section F of National Industrial Classification (NIC) 2008.” MSMEs shares about 45 per cent of India’s manufacturing output and contribute more than 40 per cent to country’s exports. About 28 per cent of the GDP is generated by this sector. MSMES provide employment to about 11.1 crore people (3.60 crore in manufacturing, 3.87 crore in trade and 3.62 crore in other services and 0.0007 crore in non-captive electricity generation and transmission) in the rural and urban areas across the country. Out of the 633.88 lakh MSMEs, 324.88 lakh (51 per cent) were in rural areas and 309 lakh MSMEs (49 per cent) were in urban areas. 


                  As on March 31, 2024, a total number of 4,15,04,899 MSMEs were registered in Udyam Registration online portal, which include 80,12,542 enterprises registered under Manufacturing category, 1,48,84,175 enterprises registered under Service and 1,86,08,182 enterprises registered under Trading category (Annual Report 2023-24, Ministry of MSME, Government of India). The sector is diverse in terms of size, levels of technology employed, and products. Existing classification of MSME units based on investment in plant/machinery/equipment and annual turnover is given below:


 Classification of MSMEs       

Composite Criteria: Investment in plant/machinery/equipment and Annual Turnover

Classification

Micro

Small

Medium

Manufacturing Enterprises and enterprises rendering Services

Investment < ₹1 crore

Investment < ₹10 crore

Investment < ₹50 crore

Turn over < ₹5 crore

Turn over < ₹50 crore

Turn over < ₹250 crore

Source: Ministry of MSME, Government of India


MSME sector in Kerala                    


                    The Micro, Small and Medium Enterprises (MSME) sector is emerging as a major income generating and employment providing sector in Kerala. At the same time, the level of investment is relatively lower in the sector. As per the MSME Survey and Quick Results of 4th Census, 5.62 cent of MSME enterprises in India are in Kerala. The MSME sector helps in industrialisation of rural and backward areas, and provides employment to youth and socially disadvantaged groups such as SC, ST, women and persons with physical disabilities.


                   Within the MSME sector there is a significant increase of micro enterprises, both in terms of working enterprises and employment. The industries coming under this sector are handicrafts, handloom, khadi, food processing industries, garment making and textile industries and industries related to coir/wood/bamboo/Plastic/rubber/leather/clay products. MSMEs produce over 8,000 various MSME products ranging from traditional to high-tech items are manufactured by MSMEs.


                  MSMEs are facilitated and supported in the State by the Government and banks. The District Industries Centres (DIC) act as a facilitator for the growth of the MSME and traditional industrial sectors in Kerala. DIC implements various schemes to develop entrepreneurial culture in the State. Industries Department provides financial assistance to start Entrepreneurship Development clubs at school and college level to develop entrepreneurial culture among the youth and to organise entrepreneurship development programmes for them. In addition, the Department has made it a priority to provide services to Start-ups and to set up business incubation centres in District Industries Centres. 


                  The economic growth of Kerala is related to the development of MSMEs. Directorate of Industries and Commerce (DIC) is implementing various schemes to increase production and employment in this sector. The agencies under the Directorate are the Directorate of Handloom & Textiles, which aims at evolving policies for the promotion and development of handloom and textile sector in the State; Directorate of Coir Development, the implementing agency for all policy decisions of the Government of Kerala related to coir industry; Khadi & Village Industries Board, vested with the responsibility of organising and promoting Khadi and Village Industries in the State, and the Directorate of Plantation, set up in 2022-23 for the development of the plantation sector in the State.


Plan Outlay and Expenditure of Directorate of Industries and Commerce, 2022-23 to 20245*, ₹ in lakh  

Sector

2022-23

2023-24

2024-25 

(as on 11/11/2024)

Outlay

Exp

Outlay

Exp

Outlay

Exp*

Small Scale Industries

12,466.3

21,270.00

12,891.9

12,891.9


20,494.00

10,439.75

Commerce

653.42

700.00

102.83


102.83


650.00

63.00

Handicrafts

166.87

420.00

131.6


131.6

420.00

92.91

Total

13,286.59

22,390.00

13,126.33


13,836.17


21,564

10,595.66

* as on November 11, 2024
Source: Plan space Kerala


Udyog Aadhar Memorandum (UAM) in the State


                  Kerala has discontinued the practice of filing Entrepreneurs Memorandum Part II from September 18, 2015, and in its place, started online registration in Udyog Aadhar. As on March 31, 2024, there were, 5,80,895 UAMs filed which include 1,59,355 manufacturing units and 4,21,540 units in the Service Sector. Manufacturing units comprised of 1,53,226 micro units, 5,529 small units and 600 medium units. Out of 4, 21,540 UAMs in the service sector, 4,08, 241 are micro, 12,474 are small and 825 are medium units. The District-wise number of Micro, Small and Medium units registered under manufacturing and service sectors in 2023-24 is given below:  


MSME Units with Udyog Aadhar Number as 31.03.2024


Name of District

Manufacturing

Services


Micro


Small


Medium


Total


Micro


Small


Medium


Total


Grant Total

Thiruvananthapuram

18046

296

31

18373

51572

1223

77

52872

71245

Kollam

10490

368

37

10895

26992

892

34

27918

38813

Pathanamthitta

4467

80

6

4553

14302

358

19

14679

19232

Alappuzha

9199

280

25

9504

24176

580

21

24777

34281

Kottayam

8105

319

40

8464

22246

834

44

23124

31588

Idukki

4407

124

7

4538

13369

417

16

13802

18340

Ernakulam

21752

1736

186

23674

56324

2925

262

59511

56796

Thrissur

17190

585

86

17861

37348

1153

68

38569

83185

Palakkad

13377

409

58

13844

33359

741

49

34149

56430

Malappuram

12944

443

26

13413

32892

975

67

33934

47993

Kozhikode

15049

393

49

15491

40201

1080

96

41377

56868

Wayanad

3819

85

15

3919

10322

251

9

10582

14501

Kannur

8813

269

23

9105

31392

733

51

32176

41281

Kasaragod

5568

142

11

5721

13746

312

12

14070

19791

Total

153226

5529

600

159355

408241

12474

825

421540

580895

Source: Directorate of Industries & Commerce


                 Number of Micro, Small and Medium units registered under Manufacturing and Service Sectors in Kerala, 2023-24

 Source: Directorate of Industires & Commerce


Performance of the Sector 


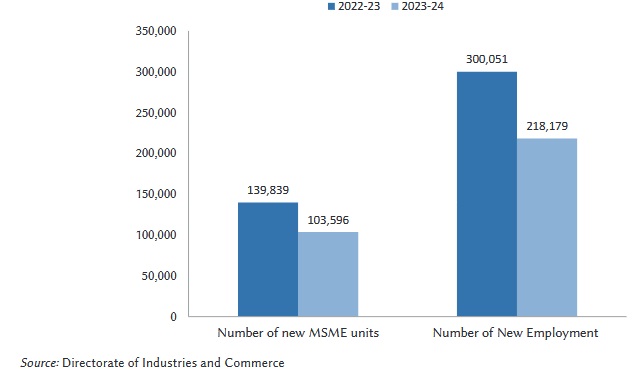
                  The State achieved remarkable surge in the number of new MSME units established in 2023-24. A total of 1, 03,596 new MSME units were set up in 2023-24 with investment of Rs.7, 048.65 crore. These units have created employment opportunities for 2,18,179 individuals, marking a sustainable expansion in the MSME sector. The details of new MSME units for the last five years are given below:


Achievement in MSME sector, 2018-19 to 2023-24 (As on March 31, 2024)

Year

No. of MSME units

Investment

(in Rs crore)

Employment

(in number)

2018-19

13826

1321.94

49068

2019-20

13695

1338.65

46081

2020-21

11540

1221.86

44975

2021-22

15,285

1,535.09

56,233

2022-23

1,39,839

8,421.63

3,00,051

2023-24

1,03,596

7,048.65

2,18,179

Total

2,97,782

20,888

7,14,587

Source: Directorate of Industries and Commerce


The number of new MSME units and employment provided for the last two years is shown below:


Number of new Micro, Small and Medium units and employment created in MSMEs in 2022-23 & 2023-24


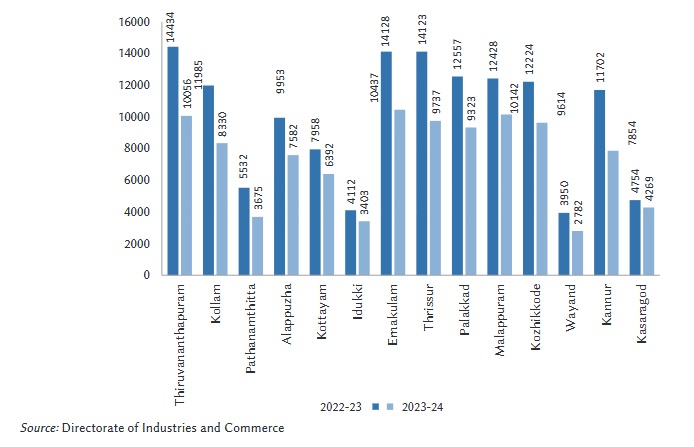
                 In 2023-24, the district with the largest numbers of new MSME units was Ernakulam (10,437 units) with an investment of Rs 1,013.77 crore, generating 25,387 employment opportunities, followed by Malappuram (10,142 units) with an investment of Rs 742.14 crore generating 23,529 employment opportunities and Thiruvananthapuram (10,056 units) with an investment of Rs 518.62 crore providing employment to 19,550 persons. Wayanad (2,782 units) had the lowest number of new enterprises (2782 units) with an investment of 212.18 crore generating employment for 6,004 persons. The district-wise details of new MSME units started in Kerala in 2023-24 is given below:


District wise details of new MSME units started in Kerala during 2023-24

Sl No

District

No of MSME units

started

Total Investment

( `Crores)

Employment generated

(Nos)

        1.       

Thiruvananthapuram

10056

518.62

19550

        2.       

Kollam

8330

504.44

17198

        3.       

Pathanamthitta

3675

197.36

7038

        4.       

Alappuzha

7582

434.49

14331

        5.       

Kottayam

6392

419.8

12367

        6.       

Idukki

3403

247.12

7399

        7.       

Ernakulam

10437

1013.77

25387

        8.       

Thrissur

9737

615.54

19993

        9.       

Palakkad

9323

616.98

20365

       10.   

Malappuram

10142

742.14

23529

       11.   

Kozhikode

9614

679.15

20665

       12.   

Wayanad

2782

212.18

6004

       13.   

Kannur

7854

521.65

15685

       14.   

Kasaragod

4269

325.41

8668

Total

103596

7048.65

218179

Source: Directorate of Industries & Commerce


   District wise new MSME units started in Kerala in 2022-23 and 2023-24             


             The sector-wise growth of MSME units over the last five years reveals an increase in the number of agro and food-based units from 2,582 in 2019-20 to 23,474 in 2022-23. The number of service related MSME units has increased from 4,036 in 2019-20 to 38,006 in 2023-24. The number of units engaged in trade is also significant. The subsector-wise details of MSME units started in the last five years is given below:


Subsector wise details of new MSME units started in Kerala

Name of subsector

2019-20

2020-21

2021-22

2022-23

2023-24

Agro and Food- based

2,582

3,359

4297

23,474

6786

Textiles and Garments

1,904

1276

1564

14,702

1890

General /mechanical/light

Engineering

1,334

989

1193

1,988

549

Service Activities

4,036

2725

4097

24556

38006

Wood Products

5,32

436

517

1,529

688

Cement Products

3,09

233

368

0

0

Printing & Allied

2,80

188

198

3,795

2728

Paper Products

1,88

198

234

659

347

Information Technology

2,40

187

348

6,091

4957

Trade activity*

-

-

-

48,945

43869

Others

2,290

1949

2469

14101

3776

Total

13,695

11,540

15,285

1,39,840

1,03,596

Source: Directorate of Industries and commerce

*From 2022-23 onwards the data of trade activity included


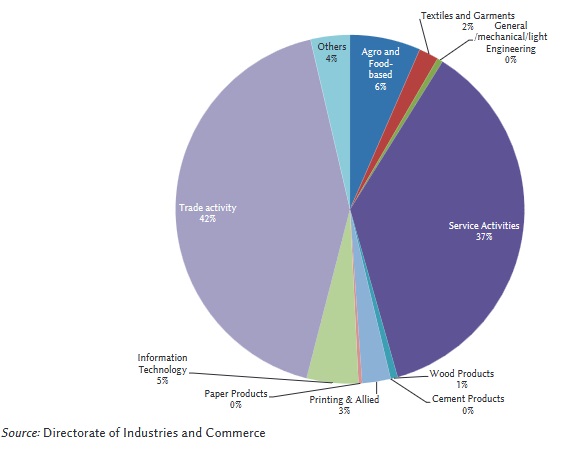
                         The top five subsectors together consist of over 80 per cent of the MSME units in the last five years. Trade Activity based units (42.4 per cent), Agro and food based (6.6 per cent) units and Service Activities (36.7 per cent) dominate in MSMEs. Units making plastic containers, gold ornaments, rubber products, handicrafts products are classified as “Others” (3.7 per cent). Textiles and garments (1.8 per cent), Information Technology (3.7 per cent) and General/Mechanical/Light Engineering (1 per cent) are the other leading subsectors. The share of each subsector is given below:


Subsector wise details of new MSME units in 2023-24


Export


Cashew:  


                 India is among the largest cashew producing countries in the world. It employs large number of workers in the farms and factories. India exports cashews to more than 60 countries. As per the Directorate General of Commercial Intelligence and Statistics, the quantity of cashew export from India in 2023- 24 is 46,235 MT and the value is Rs 2,62,021 lakhs. This was 44,948 MT and Rs 2,71,800 lakhs in 2022-23. Cashew cultivation spread along the coastal regions of peninsular India. Kerala has an important role in production, processing, and export of cashew. The export of cashew kernels from Kerala increased to 22,753 MT in 2023-24, from 21,858 MT in 2022-23, registering a positive growth of 4 per cent over the same period last year.


                  The export of cashew nuts kernel whole and Cashew Nuts Fresh/Dried in Shell together contributes 64,582 Kilograms of export volume and Rs 276,659.4 lakhs value in 2023-24. This was 58,604 Kilograms in 2022-23 with the value of Rs 2,82,044.1 lakhs. The export of cashew items except Cashew nut shell liquid (CNSL), crude & Cashew kernel, broken from India shows an increasing trend in 2023-24.  
 

Export of cashew kernels, 2016-17 to 2023-24, in Rs crore


Year

Kerala

India

Share of Kerala

(per cent)


Quantity (MT)

Value

(Rs crore)

Quantity (MT)

Value

(Rs crore)

Quantity

Value

2016-17

38,054

2,415.3

82,302

5,168.8

46.2

46.7

2017-18

36,930

2,580.4

84,352

5,871.0

43.8

44.0

2018-19

29,062

1,892.6

66,693

4,434.0

43.6

42.7

2019-20

30,478

1,742.5

67,647

3,867.2

45.1

45.1

2020-21

*23,368

NA

49,992

2,907

46.7

NA

2021-22

*24,299

NA

53,770

3,175.2

45.2

NA

2022-23

*21,858

NA

44948

2718

48.6

NA

2023-24

*22753

NA

46235

2620.2

49.2

NA

Source: Cashew Export Promotion Council of India/* Cochin Port Trust 


Export of Coir and Coir Products


                 The export of coir and coir products from India is 12,32,097 MT in volume and the value is Rs 3,39,690.9 lakhs. This is a -2.6 per cent growth over the previous year's export of 12,64,784 MT of coir and coir products. The export of coir and coir products from Kerala through Cochin Port showed an increasing trend in 2023-24. The quantity exported through Cochin Port in 2023-24 was 2,96,137 MT and recorded a positive growth of 148.1 per cent over the previous year. The export of coir and coir products through Cochin Port in 2022-23 was 1,19,350 MT.


Export trend of coir and coir products from India and Kerala (through Cochin Port), 

2017-18 to 2023-24, quantity in lakh MT


Export of Tea:


                  The export of tea from India in 2023-24 was 2,50,724 MT and the value for export was Rs 6,47,638 lakhs. This shows growth from 2,28,397 MT and a value of Rs 6,38,581 lakhs in 2022 23. Export of tea from Kerala ports in 2023-24 is 87,649 MT worth Rs 1,87,766 lakhs from 69,107 MT worth Rs 15,3,179 lakhs in 2022-23 registering a growth of 26.8 per cent in terms of quantity and 22.57 per cent in terms of value. The details are given below:  


Export of tea from Kerala ports and India, 2019-23, quantity in MT, Rs In lakhs

Year

India

Kerala

Quantity

Value

Quantity

Value

2019-20

2,41,344

5,45,710

76,983

1,47,082

2020-21

2,03,791

5,31,153

70,398

1,56,595

2021-22

2,00,785

5,41,577

64,854

1,46,841

2022-23

2,28,397

6,38,581

69,107

1,53,179

2023-24

2,50,724

6,47,638

87,649

1,87,766

Source: Tea Board


Export of Coffee:


                  Export of Coffee In 2023-24, a total quantity of 3.8 lakh MT of coffee worth Rs 3618952 crores was exported from India as against 3.9 lakh MT of coffee worth Rs 3621549 crores in 2022-23 registering a growth of (-)2.6 per cent in quantity and -0.07 per cent in value. The export of coffee from Kerala through Cochin port shows a fall in quantity exported by 34211 MT and growth by (-) 27.6 per cent, in 2023-24 compared to 47245 MT volume and (-)23.9 per cent growth in the previous year.


Export of Spices:


                  In 2023-24, the export of spices and spice products from India was 15,39,692 MT valued Rs 36,95,880.5 lakhs as compared to 14,04,357 MT valued Rs 31,76,138 lakhs in the previous year. This registers a increase of 9.6 per cent in volume and an increase in value by 16.4 per cent. The export of spices from Kerala in 2023 24 was 1,19,434 MT and the value of export was Rs 6,41,092.9 lakh. This shows an increase in quantity traded by 7.5 per cent and value by 16.2 per cent over the previous year.


 Export of spices, India and Kerala, from 2017-18 to 2023-24, quantity in MT and value in ₹ lakh   

Year

Kerala

India

Kerala’s share

(per cent)

Quantity

(in MT)

Value

(Rs lakh)

Quantity (in MT)

Value

(Rs lakh)

Quantity

Value

2017-18

95,455.90

4,15,296.10

10,28,060

17,98,016.2

9.30

23.10

2018-19

89,590.80

3,78,560.40

11,00,250

19,50,581.1

8.10

19.40

2019-20

1,00,195.80

4,05,421.30

12,08,400

22,06,280.0

8.30

18.40

2020-21

1,21,348.90

5,00,633.60

17,58,266

30,96,771

6.90

16.20

2021-22

1,23,547.93

5,66,643.60

15,30,661

30,32,432.4

8.10

18.50

2022-23

1,11,080.13

5,51,521.02

14,04,357

31,76,138.2

7.90

17.36

2023-24

1,19,433.95

6,41,092.88

15,39,692

36,95,880.50

7.75

17.34

Source: Spices Board * Provisional


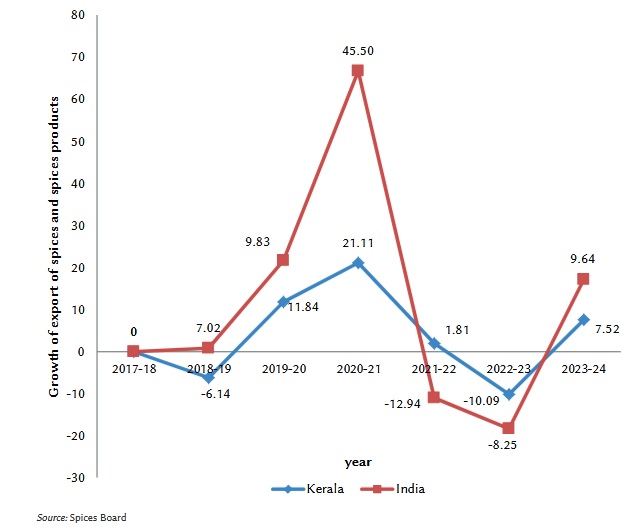
                 Kerala's export of spices and spice products, in quantitative terms, showed an increasing trend onwards 2018-19 and it continue up to 2020-21. A decline was registered during the year 2021-22. The year 2022-23 registered a negative growth of (-)10 and registered a positive growth of 7.5 for the year 2023-24. With regard to India's exports in spices shows negative growth for two consecutive years of 2021-22 and 2022-23 and then it shows a positive growth during the year 2023-24 (9.6 per cent). Figure depicts the trend in the growth of exports of spices and spice products from India and Kerala.


Trend in growth of export of spices and spice products from India and Kerala, 2017-18 to 2023-24, quantity in per cent


                     In 2023-24, the export of individual spices like cardamom small, cardamom large, ginger, fenugreek, mint products & miscellaneous spices from Kerala showed a decrease both in volume and value as compared to the previous year. A total volume of 4,001.4 MT of cardamom (small) valued Rs 698 crore was exported from Kerala in 2023-24 as against 4,345.1 MT valued Rs 550 crore in 2022-23. Export of chilli 28,867.18 MT valued Rs 906.3 crore in 2023-24 shows an increase from 25,717 MT valued Rs 659.7 crore from the previous year. The export of pepper increased to 15568 MT valued Rs 649.8 crores in 2023-24 as against 12,491.2 MT valued Rs 575.2 crores in 2022-23.


               In the case of value-added products export of curry powder & mixture and spice oil & oleoresins products showed an increase in volume and value in 2023-24 in terms of quantity as compared to 2022-23. Export of curry powder and mixture in 2022-23 was 17,505.2 MT valued Rs 408.6 crore which rose to 18,663 MT valued Rs 504.5 crore in 2023-24 recording an increase in volume and value of export. Export of spice oil & oleoresins products in 2022-23 was 9766.4 MT valued Rs 2,365.4 crore which rose to 10,587.2 MT valued Rs 2,636.8 crore in 2023-24 recording an increase in volume and value of export.