Infrastructure
.jpg)
.jpg)
Infrastructure forms the foundation on which social, economic and Industrial Development is built. Kerala is among the well performing states in India and holds an important position in the industrial front. The state holds significant industrial potential owing to good infrastructure facilities like power, transport system, airports, port and harbours and availability of rare materials. Central agencies like Railways, National Highways, Ports, Post and Telegraph, Telecommunication and Civil Aviation Authorities play a significant role in providing infrastructure facilities.Transport infrastructure of the State consists of 3.31 lakh Kms of road, 1257 Kms of Railways, 1687 Kms of Inland Waterways and 111 statute miles of Airways and 18 Ports.
Housing:
Housing is a basic requirement of human well -being. Information in respect of the dwelling unit of the households like type of the dwelling unit (viz. independent house, flat etc.), tenurial status of dwelling unit (viz. owned, hired, no dwelling etc.), structure of the dwelling unit (viz. pucca, semi-pucca, katcha), condition of the structure (viz. good, satisfactory, bad), floor area of the dwelling unit, age of the house owned by the household, etc. along with the facilities available to the households in respect of drinking water, sanitation etc. and micro environment surrounding the house like drainage system of the house, system of disposal of household waste water, system of disposal of household garbage, problems of flies and mosquitoes etc. are important determinants of overall quality of living condition of the house hold members.
Status:
Based on the 76th NSS Socio Economic Survey report (July 2018- December 2018) published by Department of Economics and Statistics analyses the following factors regarding housing status. The average household size in rural and urban Kerala was 3.9 and 3.8 respectively. Among the households living in houses, about 99 percent of the households in the rural areas and about 93.7 percent of the households in the urban areas had independent house. About 89.1 percent of the households in the rural areas and about 90.2 percent of the households in the urban areas had the house of pucca structure.
The percentage distributions of households, in Kerala, living in houses by type of the dwelling unit, type of structure of the dwelling unit and type of ventilation of the dwelling unit is given below:
⇒ Housing status 2003-04
Transport Infrastructure:
Major transport infrastructure of the Stateconsists of 2.73 lakh km of road, 1588 km ofrailways, 1687 km of inland waterways and18 ports with 585 km coastal route and4airports. Roads play a prominent role in public transportation visa-vis-other modes of transportation owing to the geographicpeculiarities of Kerala with a comparatively lesserrural urban divide and limited geographicalarea of 38,863 Sq. km. Kerala has a total fleet of25,186 buses; of which 19,496 are private buses(77.4 per cent) and 5690 buses belonging toKerala State Road Transport Corporation (KSRTC)comprising 22.6 per cent of the total fleet. Privatebuses dominate transport in all districts of Keralaexcept Thiruvananthapuram. The State has a railnetwork of 1,257 km route length with a totaltrack length of 1,588 km, operating under thecontrol of Palakkad and ThiruvananthapuramRailway Divisions. In Kerala, there are manywater bodies like rivers, lakes, estuaries,backwaters etc. providing adequate scope forInland Water Transport (IWT) system having alength of 1,895 km to connect the rivers from oneto another. Transportation by IWT is consideredas the most efficient economic and environmentfriendly means of transportation. Transportationby coastal shipping is the mode for most bulkcommodities and long hauling traffic. Kerala has the advantage of a 585 km coast line throughwhich bulk cargos can be transported using multi–modal transhipment points along the coastline.
Kerala has one major port at Kochi, 17 minorports and an upcoming international shipping terminal at Vizhinjam. Out of the 17 minor portsin Kerala, four are considered intermediate portsviz., Vizhinjam, Beypore, Azhikkal and Kollambased on berthing, cargo handling and storagefacilities available in them. Kerala has fourinternational airports viz., Thiruvananthapuram, Kochi, Kozhikode and Kannur.All civilian airports functioning in the State are international airports,a feature unique to Kerala. Kerala joined TamilNadu as the State with the maximum number ofinternational airports on completion of Kannurinternational airport. Realising the advantagesof mass transport system in meeting the Intracity commuter needs of major cities, GoK has embarked on Metro Rail Project for Kochi. Withthe commissioning of Mass Rapid Transit System(MRTS), major urban corridors are expected to bedecongested in these cities.
Road Network in Kerala
The roads in Kerala are maintained by National Highways / Public Works Department (R&B), Local Bodies, Department of Irrigation, KSEB, Department of Forests, Railways etc. Other agencies dealing with transport sector are National Transportation Planning and Research Centre (NATPAC), Motor Vehicles Department, Kerala State Road Transport Corporation (KSRTC), Kerala Transport Development Finance Corporation (KTDFC) and Roads & Bridges Development Corporation of Kerala (RBDCK).
The State has a total road length of 1, 91, 292.39 km. This includes classified and non-classified roads as stipulated by Indian Road Congress. The National Highways, State Highways and Major District Roads (MDRs) together handle about 80 per cent of the total road traffic. The major development indicators of transport and communication sector in Kerala since 2013 are given here.
National Highways in Kerala
The State has a total road length of 2,30,934.18km. This includes classified and non-classified roads as stipulated by Indian Road Congress. Road density in Kerala is 548km per 100 sq. km, which is roughly three times the national average. The length of road per lakh population is 993.54 km and almost 90 per cent of the road network is single lane. The National Highways, considered to be the primary network, carries 40 per cent of the total traffic, and the State Highways and Major District Roads (MDRs)-the secondary road network – carries another 40 per cent of the road traffic. Thus around 12 per cent of the road network handles almost 80 per cent of the traffic in the State.
There are 11 National Highways (NHs) in the State with a total length of 1,781 km. Out of this, the NH wing of State PWD upkeeps 548 km (31 per cent) of the National Highways and the remaining 1233 km is maintained by the National Highway Authority of India (NHAI) under Ministry of Road Transport and Highways (MoRTH). The District wise status of roads maintained by PWD (NH) wing is given here and the length of National Highways in the State is provided is given below:
Length of National Highways (NHs) in Kerala
|
New No.
|
Old No.
|
NHAI/PWD
|
From
|
To
|
Length of NH in Kerala(Km)
|
|
66
|
17
|
NHAI
|
Thalappadi
|
Edappally
|
420.77
|
|
17
|
NHAI
|
Edappally
|
Kaliyikkavila
|
248.66
|
|
544
|
47
|
NHAI
|
Walayar
|
Edappally
|
168.14
|
|
85
|
49
|
NHAI
|
Bodimettu
|
Kundanoor
|
167.59
|
|
744
|
208
|
NHAI
|
Kollam
|
Kazhuthuruthy
|
81.28
|
|
766
|
212
|
State PWD
|
Kozhikode
|
Muthanga(Kerala-Karnataka Border)
|
117.6
|
|
966
|
213
|
NHAI
|
Kozhikode
|
Palakkad
|
125.3
|
|
183
|
220
|
State PWD
|
Kollam
|
Theni (Tamil Nadu Border)
|
216.30
|
|
966 B
|
47 A
|
State PWD
|
Wellington Island
|
Kundanoor
|
5.92
|
|
966 A
|
47 C
|
NHAI
|
Vallarpadam
|
Kalamassery
|
17.2
|
|
183 A
|
|
State PWD
|
Bharanikkavu
|
Vandipperiyar (via) Pathanamthitta
|
116.80
|
|
185
|
|
State PWD
|
Adimaly
|
Kumili (via) Painavu
|
96
|
|
|
Total
|
|
|
|
1781.56
|
|
Source : PWD(NH)
|
The major roads in the State are developed and maintained by the State Public Works Department. The total length of roads maintained by Public Works Department (PWD)- Roads and Bridges (R&B) is 29,573.16 km in 2022-23. The total length of roads maintained by Public Works Department (PWD Roads) is 29,573 km in 2023-24. This comprises of 4,128 km (13.95 per cent) State Highways and 25,445 km (86.04 per cent) of Major District Roads (MDRs). Out of the total length of the State Highways, 898 km is four lanes, 3,193 km is two lanes and remaining 35 km single lane roads. The Major District Roads cover 25,445 km, of which, 52 km of roads are four lanes, 10,593 km two lanes and 14,748 km single lane roads. Local Self Government own and operates 79.7 per cent of the total road network in Kerala whereas the PWD (Roads) maintains 15.5 per cent of roads. The PWD (NH) wing upkeeps 0.3 per cent of the total road length and 3.9 per cent of roads are called “other roads” which are constructed and maintained by Railways, Irrigation, KSEB, Forest and Devaswom departments.
Kottayam District has highest share of PWD roads with 3,040 km (10.3 per cent). Wayanad District is at the bottom with 914 km (3.1 per cent). Details of District-wise category and surface -wise length of roads maintained by PWD (Roads) and Agency wise details of roads developed and maintained in the State is depicted are given below:
|
District-wise, Surface-wise & Category-wise Length of Roads Maintained by PWD (Roads) in km
|
|
Sl.No
|
Name of District
|
State Highways
|
Major District Roads
|
Total
|
|
BT
|
BT
|
|
|
1
|
Thiruvananthapuram
|
226.60
|
2,150.44
|
2,377.04
|
|
2
|
Kollam
|
149.61
|
1,774.98
|
1,924.59
|
|
3
|
Alappuzha
|
170.42
|
1,309.29
|
1,479.71
|
|
4
|
Pathanamthitta
|
249.60
|
1,744.51
|
1,994.11
|
|
5
|
Kottayam
|
340.04
|
2,700.11
|
3,040.15
|
|
6
|
Idukki
|
872.53
|
1,788.75
|
2,661.28
|
|
7
|
Ernakulam
|
401.97
|
2,562.59
|
2,964.56
|
|
8
|
Thrissur
|
381.45
|
1,552.72
|
1,934.17
|
|
9
|
Palakkad
|
217.81
|
1,866.37
|
2,084.18
|
|
10
|
Malappuram
|
384.05
|
2,056.42
|
2,440.47
|
|
11
|
Kozhikode
|
202.15
|
1,797.14
|
1,999.29
|
|
12
|
Wayanad
|
145.71
|
768.26
|
913.97
|
|
13
|
Kannur
|
244.10
|
2,070.62
|
2,314.72
|
|
14
|
Kasaragod
|
142.34
|
1,302.58
|
1,444.92
|
|
Total Length (in Kms)
|
4,128.38
|
25,444.78
|
29,573.16
|
|
Source: PWD (Roads) BT Bituminous Surface
|
|
Category-wise Length of Roads Maintained by PWD (Roads) in km as on 31.08.202
|
|
Item
|
State Highways
|
Major District Roads
|
Total
|
|
Cement Concrete
|
|
|
|
|
Length as on 31.03.2024
|
|
|
|
|
Length added in 2023-24
|
|
|
|
|
Length as on 31.08.2024
|
|
|
|
|
Black Topped
|
|
|
|
|
Length as on 31.03.2024
|
4,128.38
|
25,444.78
|
29,573.16
|
|
Length added in 2023-24
|
|
|
|
|
Length as on 31.08.2024
|
4,128.38
|
25,444.78
|
29,573.16
|
|
Water Bound Macadam
|
|
|
|
|
Length as on 31.03.2024
|
|
|
|
|
Length added in 2023-24
|
|
|
|
|
Length as on 31.08.2023
|
|
|
|
|
Others
|
|
|
|
|
Length as on 31.03.2024
|
|
|
|
|
Length added in 2023-24
|
|
|
|
|
Length as on 31.08.2024
|
|
|
|
|
Total
|
|
|
|
|
Length as on 31.03.2024
|
4,128.38
|
25,444.78
|
29,573.16
|
|
Length added in 2023-24
|
|
|
|
|
Length as on 31.08.2024
|
4,128.38
|
25,444.78
|
29,573.16
|
|
Source: PWD (Roads)
|
Length of Roads Maintained by Different Agencies, in per cent
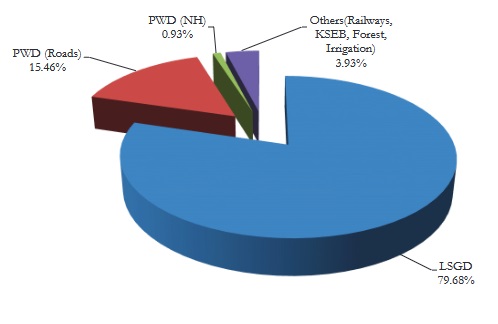
Source: Various Departments
The total length of roads maintained by different local bodies in 2022-23 is 1,96,773 km., of which 1,70,101 km (86.44 per cent) is maintained by District and Grama Panchayats, 18,139 km (9.2 per cent) by Municipalities and 8,533 km (4.3 per cent) is maintained by the corporations. In 2023-24 the total length of roads maintained by different local bodies is 1,52,422 km., of which 1,28,048 km (84 per cent) is maintained by District and Grama Panchayats, 16,560 km (10.9 per cent) by Municipalities and 7,813 km (5.1 per cent) is maintained by the Corporations. Roads maintained by various local bodies is given below:
|
Roads maintained by various Local Bodies, in km
|
|
Local Body
|
Black Topped
|
Concrete / cement road
|
Earthen road
|
Total
|
|
Corporations
|
5,082
|
2,172
|
559
|
7,813
|
|
Municipality
|
10,142
|
3,815
|
2,602
|
16,560
|
|
District Panchayat
|
129
|
6
|
5
|
140
|
|
Block Panchayat
|
Block Panchayat does not have any road assets.
|
|
Grama Panchayat
|
65,372
|
28,927
|
33,609
|
1,27,908
|
|
Total
|
80,726
|
34,920
|
36,775
|
1,52,422#
|
|
Source: Local Self Government Department
# Note: The total road length submitted in previous years, based on manual entries in the asset register, was inaccurate due to duplications from changes in road surfacing. To solve the issue and provide accurate information, KSREC developed GIS mapping software.
|
The PWD (Bridges) wing maintains a total of 2,837 bridges along State Highways (546 Bridges), Major District Roads (2,141) and Other District Roads Village Roads and Railway over Bridges (ROB) (150 Bridges). The wing focus on the construction of aesthetic bridges using modern technology such as bow string arch bridges, extradosed bridges, integral and semi-integral bridges. In 2023-24, the bridges wing had completed the construction of 42 bridges at a cost of Rs.256.68 crore. The notable achievement of the Wing is the completion and opening of the Valiyazheekkal Bridge of 981-meter-long, which has bow string arch of 110-meter span and 12-meter height to facilitate water transport.
Rail Transport
Kerala occupies a significant position on the Indian Railways map with a total track length of 2,106 comes under Thiruvananthapuram and Palakkad (Palghat) divisions of the Southern Railways. Palakkad Division has a total route length of 1,075 km and operates 99 mail and express and 60 passenger trains and 64 freight trains. Thiruvananthapuram division has a total route length of 1,031.7 km and operates about 170 mail/ express /passenger trains and 8 goods trains per day. All the railway lines passing through the State have been converted into broad gauge. There are 200 railway stations in the State (95 under Palakkad Division and 105 under Thiruvananthapuram Division). Doubling and electrification works are in progress in various parts of the State. Feasibility studies for new lines including the coastal railway line connecting Kodungallur, Nedumangad, Malappuram and Manjeri are underway in the railway sector.
Kerala Rail Development Corporation (KRDCL)
Kerala Rail Development Corporation Limited has been incorporated as a joint venture company with an equity share of 51 per cent and 49 per cent between Government of Kerala and Government of India. KRDCL has initiated preliminary surveys of proposed Broad Gauge (BG) line between Thalassery and Mysore (via Mananthavady) and Nilambur to Nanjangud. It has proposed a common gateway across Western Ghats to meet the requirements of both the lines. The agency has completed Kerala side survey of the Thalassery and Mysore line and the concessionaire. M/s Konkan Rail Corporation Limited has prepared the revised feasibility report for 200km corridor. The estimated cost of the project is ₹13,987 crore. Consent from Government of Karnataka is awaited.
The DPR for the development of new terminus station at Ernakulam with Commercial Development Plan has been submitted to Railway Board in December, 2017 for approval. KRDCL has also submitted feasibility report for development of Ernakulam marshalling yard as a world class coaching terminal with feasibility of integration with the proposed Silver Line and existing Kochi Metro and commercial exploitation of land. The SPV is also waiting for a green signal for Angamaly-Erumeli-Sabari new railway line which was included in the 1997-1998 works programme of Indian Railways. The Kerala Rail Development Corporation Limited (KRDCL) has prepared the DPR for the proposed Silver Line Project through M/s Systoa, Paris and this has been approved by the Government of Kerala. The report estimate the project cost to be ₹63,941 crore and expects to complete by 2025.
Kerala Rail Development Corporation Limited has been incorporated as a joint venture company with an equity share of 51 per cent and 49 per cent between Government of Kerala and Government of India. This has been formed with the objective of taking up major railway infrastructure development projects in Kerala on a cost sharing mode. The company has an initial paid-up capital of Rs 100 crore which can be enhanced, based on the quantum of projects to be undertaken.
Semi High-Speed Rail Project (Silver Line)
The 529.45 km long semi high-speed rail corridor (Silver line) connecting Kasaragod and Thiruvananthapuram will enable to run its train at an operating speed of 200 kmph. This will have 1,435 mm Standard Gauge and double track. It is proposed to have a rolling stock of 9 cars initially, which will be increased to 12 cars. This will ease the transport between North and South ends of the State and reduce the total travel time to 4 hours against the existing 10 to 12 hours. The project is envisaged as a 100 per cent green project. The corridor will traverse through 11 Districts and have 11 stations. It will connect airports, IT Parks, health facilities, institutions, cultural amenities, and commercial nodes. The Kerala Rail Development Corporation Limited (KRDCL) has prepared the DPR for proposed the Silver Line Project through M/s Systoa, Paris and this has been approved by the Government of Kerala.
Broad-Gauge Line from Thalassery to Mysore (240 km), km), construction and commissioning of 27 Road Over Bridges are the other projects being planned to execute through KRDCL. The agency has already completed the LiDAR survey works for the Angamali-Sabari rail project.
Kochi Metro Rail Project (KMRP)
Kochi Metro Rail Project is the flagship project of the GoK designed to address the transportation woes of Kochi city. The project is implemented through the Kochi Metro Rail Ltd (KMRL) which is an SPV jointly owned by the GoK and GoI through equity participation. The GoI sanctioned the Phase I (Blue Line) of the project in July 2012 to construct a fully elevated metro on a viaduct with 22 stations for 25.2 km stretch from Aluva-Petta at a total cost of Rs 6,218.14 crore (revised) and this was commissioned on June 19, 2017.
The Extension of Phase I (Petta to Thrippunithura Terminal) consists of two Phases, Phase IA from Petta to SN Junction (1.80 km) and Phase IB from SN Junction to Thrippunithura Terminal (1.2 km). The Phase IA of the project with an approved cost of Rs 7,10.93 crore was commissioned in September, 2022 and the Phase IB having a total project cost of Rs 448.33 crore is expected to be completed by early 2024. Considering the revised DPR, Alternate Analysis Report and Comprehensive Plan submitted to the Ministry of Housing and Urban Affairs (MoUHA) by KMRL, the department of Expenditure, Government of India have accorded ‘In principle’ approval for the Phase II (Pink Line) of Kochi Metro Rail Project from JLN Stadium to Infopark via Kakkanad (11.2) at the cost of Rs 1,957.05 crore and foundation stone for the project was laid on September, 2022.
The gross revenue earnings of Kochi Metro have increased from Rs.132.21 crore in 2022 23 to Rs.168.23 crore in 2023-24. An amount of Rs.74.31 crore was earned till August 2024 by the Kochi Metro Rail Corporation. The gross revenue expenditure of Kochi Metro is Rs.145.28 crore in 2023-24. In 2022-23, it was Rs. 127.00 crore. The number of passengers carried increased to 323 lakhs in 2023-24 as compared to 249 in 2022-23. The revenue earnings and expenditure of Kochi Metro Rail Project for the period from 2017-2024(up to August) is depicted below:
Revenue Earnings and Expenditure of Kochi Metro Rail Project, 2017 to 2024, ₹ in crore
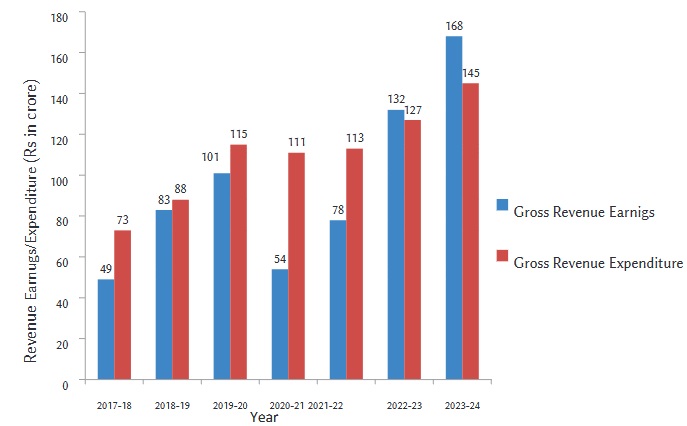
Source: Kochi Metro Rail Ltd. (KMRL)
Water Metro Project
The Kochi Water Metro is an innovative and sustainable mode of transportation that connects various parts of the city through its intricate network of waterways. The ambitious and environmentally conscious integrated water transport system which is first of its kind in India started commercial operation on April 25, 2023. The Water Metro Project comprises of fifteen (15) identified routes connecting thirty eight (38) jetties across ten (10) island communities and 2 boat yards. The overall length of the line lengths of these 15 routes is 76.2 line kilo meters. More than 34,000 islanders are expected to benefit from the water metro. There are 78 eco-friendly boats for passenger service, 23 of them are 100 pax and the remaining 55 are meant for 50 passengers. The project is expected to reduce pollution and traffic congestions in the city and also ease access to business areas on the mainland for urban households situated along the Kochi lakeshore. It is envisaged to be a socially inclusive transport system than being just a transport service with focus on improved livelihoods through commercial property development and tourism-based initiatives. Water Metro has won the covetous Gussie Award (France) for the best commercial passenger electric boats in 2022.
Water Metro has won the awards like covetous Gussie Award (France) for the best commercial passenger electric boats in 2022, Urban Mobility Conference Awards 2023 and Urban Infrastructure Award in 2023 in the “Global Maritime India Summit 2023”.
Air Transport
India’s aviation sector has been among the fastest growing in the world. According to Airports council internationals’ long-term forecast, India is expected to grow by 339 per cent over 2022 by 2041, reaching 1.1 billion passengers flown. The Civil Aviation Ministry has recently presented a Draft Aircraft Bill, 2023 which acknowledges the need to revamp, streamline and simplify existing regulations for meeting the current needs of the aviation industry.
With the establishment of Kannur International Airport in 2019, the State has four operational international airports and aviation industry in Kerala has emerged as one of the fastest growing in recent times. Of these four airports, Kochi and Kannur airports are developed on PPP basis, Thiruvananthapuram was transferred to Adani Group for development under PPP mode whereas the airport at Kozhikode is owned by Airport Authority of India (AAI).
Cochin International Airport Limited (CIAL)
CIAL handled 8.9 million passengers in 2022-23 and 10.5 million passengers in 2023-24. CIAL has accomplished a remarkable record gross income of Rs 770.91 crore in the 2022-23 and Rs.1,014.00 crore in the 2023-24 fiscal year surpassing the annual revenues of all the previous years. The details of passenger movement though Cochin International Airport (domestic and international from 2019 to 2023. The details of passenger movement though Cochin International Airport (domestic and international from 2019 to 2024 is given below:
Passenger Traffic in Cochin International Airport, 2019 to 2024
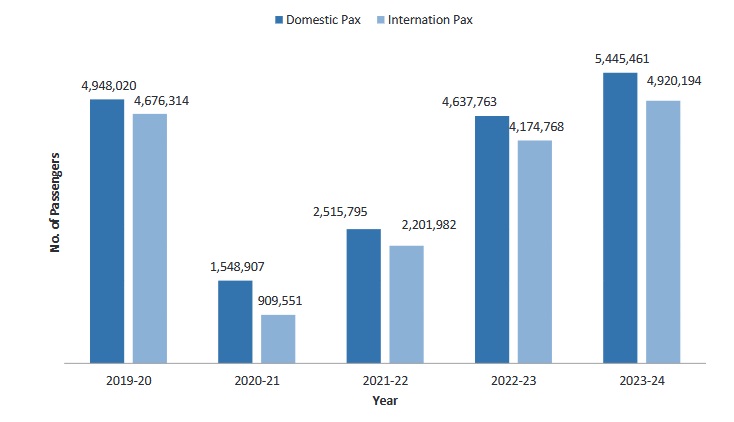
Source: Airport Authority of India
In 2023-24, 29,502 international and 37,967 domestic flights were operated from the airport as compared to the 25,724 international and 32,554 domestic flights in 2022-23. In 2023-24, CIAL handled 49,20,194 international and 54,45,461 domestic passengers, resulting in 18.8 per cent increase in the passenger movement over 2022 23. In 2022-23, it handled 41,74,768 international and 46,37,763 domestic passengers. By handling a total of 88.12 lakh passengers in 2022-23, the Cochin International Airport became the third airport in the country in terms of passenger traffic. The airport witnessed about 5 per cent increase in the cargo movement in 2022-23, it handled 56,773 MT cargo in 2022-23 as compared to 59,973 MT in the previous year. CIAL has earned revenue of Rs.29, 339.59 lakh from operation in 2023-24 and it was Rs.26, 623.06 lakh in previous financial year. That is, increase of 10.2 per cent in earnings from operation in 2023-24 over 2022-23.
Kannur International Airport Limited (KIAL)
Kannur International Airport Limited (KIAL) was set up by Government of Kerala to build and operate Kannur International airport. The airport project is being developed in two phases by KIAL. The first phase is envisaged to span from 2016- 17 to 2025-26 and second phase would be from 2026-27 to 2045-46. The first phase was inaugurated in December 2018. The airport will help the Non- Resident Keralites (NRKs), especially working in the Middle East region and boost tourism and exports which will open up several job opportunities.
The facilities in the airport include a runway length of 3,050m (10,006.56ft.), with a terminal building of 96,000sq.m, 20 parking stands (apron), and 22,000sq.m car/bus parking, 1,200sq.m. ATC/ Technical Building and around 7,750sq.m near the apron area of Ground Service Equipment parking area.
In 2022-23, the number of domestic flights operated from Kannur Airport remained almost unchanged as compared to the previous financial year, it operated 5,727 domestic flights in 2022-23 and it was 5,730 in 2021-22. Unlike the domestic aircraft movement, the airport experienced a spike in the number of international flights from 4,130 in 2021-22 to 6,212 in 2022-23, recording an increase of 50.41 per cent in international flight operation.
In 2023-24, the number of domestic flights operated from Kannur Airport is 5,969 and in 2022-23 it was 5,791. The airport experienced a spike in the number of international flights from 6,233 in 2022-23 to 5,002 in 2023-24, recording a decrease of 19 per cent in international flight operation.
In 2023-24, the airport witnessed decrease in the passenger traffic of about 6.7 per cent over the previous year. The total number of passengers handled in 2023-24 is 11, 77,891 which includes the domestic passenger traffic of 4,13,354 and international passengers’ traffic of 7,64,537 pax. The passenger traffic (domestic and international) of the Kannur International Airport is illustrated below:
Passenger Traffic in Kannur International Airport, 2019 to 2024
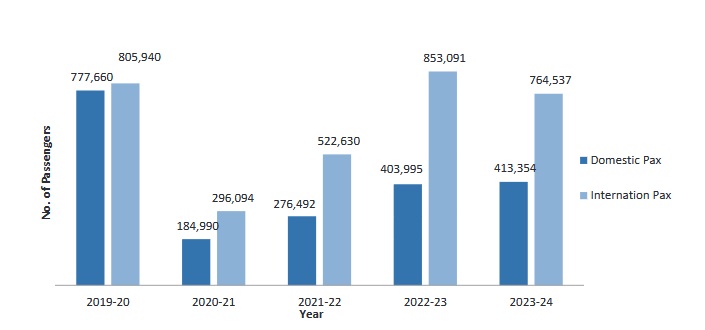
Source: Airport Authority of India
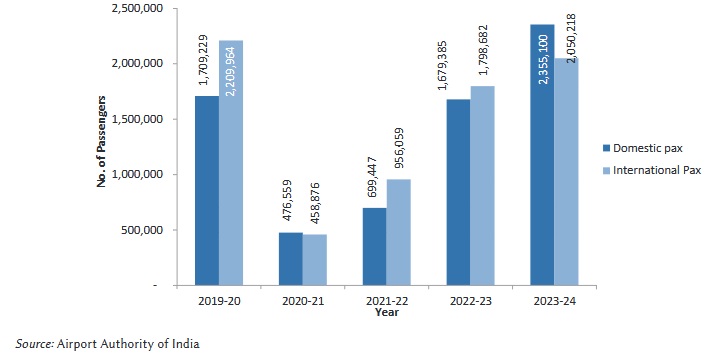
Thiruvananthapuram International Airport
Thiruvananthapuram International Airport, established in 1932, is the first airport in Kerala. The Airport operates through two terminals that feature Terminal 1 that manages domestic flight operations, except for Air India flights and Terminal 2 that manages all international flight operations as well as all domestic flights by Air India. The airport has a single runway that is 11,178 feet (3,407 meter) long. The Thiruvananthapuram International Airport, spread over an area of 700 acres (280 ha), is the second busiest airport in Kerala and the fourteenth busiest in India. International operations of the airport are mostly to Middle Eastern and South Eastern countries.
In 2023-24, 13,216 international and 16,925 domestic flights were operated from the airport. With regard to the passenger movement, the airport handled 20,50,218 international and 23,55,100 domestic passengers. The airport handled 18,392 MT cargo in 2023-24. The passenger traffic (domestic and international) of the Thiruvananthapuram International Airport is illustrated below:
Passenger Traffic in Thiruvananthapuram International Airport, 2019 to 2024
Sabarimala Greenfield Airport Project
Sabarimala Airport project aims to build a Greenfield airport at Erumely of Kottayam District for the convenience of Sabarimala pilgrims and also to fillip to tourism and local economy ofPathanamthitta, Kottayam, and Idukki Districts. The proposed site spread over 2,263 acres (9.16 Sq.km) of land at Cheruvally estate in Manimala Panchayath of Kanjirappally Taluk which is located on the way to the hill shrine. As per the Master Plan for the project, the airport will have of runway length not less than 3,500 meter on 08/26 alignment. The Sabarimala Greenfield Airport will become the 5th International Airport in the State once commissioned.
Water Transport
Water transport is the cheapest and the oldest mode of public transport. It has played a very significant role in bringing different parts of the world closer and is indispensable to foreign trade. In Kerala, water transport has the potential to become a viable supplement to road and rail transport. Its huge carrying capacity and suitability for carrying bulk goods over long distances makes water transport more attractive. For enhancing the efficiency and sustainability of water transport, a comprehensive framework for the key aspects of navigation has to be established. This section reviews the performance of the sector, effectiveness of various Government Plans and policies aimed at the overall development of ports and inland waterways, their facilitation and promotion of coastal shipping, foreign trade, and inland water transport.
Ports in Kerala
Kerala has a coastal length of approximately 590 km. There is one Major Port at Cochin and 17 non-major ports and another upcoming transhipment port at Vizhijnam being developed through PPP mode. Out of 17 non-major ports in Kerala, four are considered as intermediate ports based on berthing, cargo handling and storage facilities available in them. They are Vizhinjam, Beypore-Kozhikode, Azhikkal and Kollam Ports. There is also an inland port at Nattakom in Kottayam. In 2022-23, 1120 vessels were inspected of which 830 vessels were found to be perfect and 290 were found to be defective. As the port department is implementing the KIV rules, it conducts inspections and facilitates registration of vessels.
In 2023-24, 1145 vessels were inspected of which 904 vessels were found to be perfect and 241 were found to be defective.
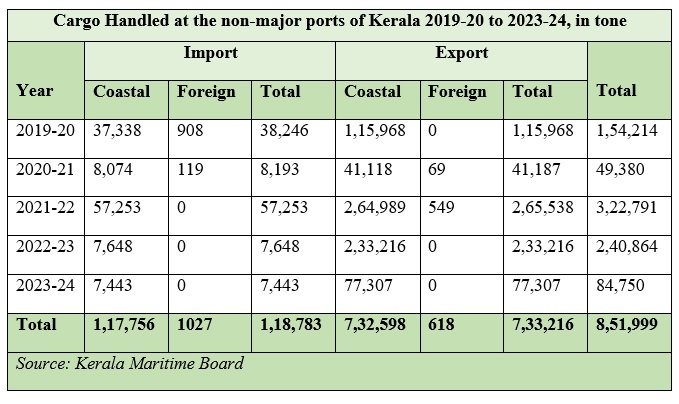
Cargo Handled in Intermediate Ports and Minor Ports in Kerala
The table below shows the details of cargo handled by non-major ports in Kerala from 2019-24. The quantity of cargo handled by Kerala’s non-major ports varies significantly year on year when analysing the last five years. In all these five years, export cargo (coastal and overseas) is higher than import cargo (coastal and overseas). The total cargo export from Kerala was 2,33,216 tonne in 2022-23 and 77,307 tonne in 2023-24.
Cargo Handled at the non-major ports of Kerala 2019 -20 to 2023-2024, in tonne
Cochin Port
Cochin Port is the only major port in Kerala. It spreads over 827 hectares. It has a water frontage of 7.5 km. The port has connectivity to hinterland through NH 544, NH 66 and NH 185. Rail links to the Konkan and Southern Railway also give key rail access to its hinterland. An inland waterway connecting Kollam and Kottappuram is being developed on either side by the Inland Waterways Authority of India. Cochin with its proximity to the international sea route between Europe and the Far East and Australia can attract a large number of container lines offering immense business opportunities.
From April to March, 2023-24, Cochin port handled 4.4 per cent of the total cargo handled by India’s 12 major ports. Details are given below:
Year-wise Cargo Handled at Cochin Port (In thousand tonnes)
| |
Financial Year (2022-23)
|
Financial Year (2023-24)
|
|
Cargo handled
|
%t Share of total Major ports
|
Cargo handled
|
per cent Share of total Major ports
|
|
Overseas
|
23,149
|
3.9
|
23,686
|
3.76
|
|
Coastal
|
12,106
|
6.6
|
12,628
|
6.75
|
|
Total
|
35,255
|
4.50
|
36,315
|
4.44
|
|
Source: Port Data Management Portal (PDMP), Ministry of Ports, Shipping and Waterways, P- Provisional
|
Vizhinjam International Seaport Limited (VISL)
Vizhinjam International Transshipment –Terminal will be the first deep water transshipment terminal in India. The main advantage of Vizhinjam port is natural depth of 18m, 10 nautical miles from the major international shipping route and minimal littoral drift along the coast. Government of Kerala has constituted a special purpose vehicle namely Vizhinjam International Sea port Limited (VISL) to facilitate the implementation of the project. VISL is the implementation agency for all obligations and responsibilities of the Government of Kerala in respect of project and the concession agreement. The Vizhinjam port has many geographical advantages to be developed as an international transshipment terminal. The availability of 20m contour within one nautical mile from the coast and minimal littoral drift along the coast demanding hardly any maintenance dredging, links to national/regional road and rail network, proximity to International shipping route and flexibility to design and develop as a Greenfield project are the notable advantages.
Port operation and development is also planned on PPP model for an agreed concession time period. Terminal operator(s) will be required to develop the container yard, terminal buildings, and purchase and operate the cargo handling equipments. As per project funding pattern of VISL, the largest share comes from the State Government which accounts for about 60.46 per cent out of the total funding followed by concessionaire (Adani Vizhinjam Port Private Ltd.) which accounts for 29.89 per cent and the remaining 9.65 per cent is contributed by the Government of India.
Malabar International Port and SEZ Limited (Azhikkal Port)
Malabar International Port and SEZ Limited (MIPS Ltd), a Company wholly owned by the Government of Kerala was incorporated to execute the project for development of Azhikkal Port. Azhikkal Port is envisaged as an international as well as coastal shipping seaport with intermodal connectivity with SEZs/industrial parks that can funnel cargo to the port and entrepreneurial resources into potential sectors in the Malabar region.
The development of a new seaport for domestic and international cargo in the open sea at Azhikkal is envisaged in 3 Phases - capable of handling up to Panamax size ships (capacity of 4000 to 4500 containers). A 500-metre berth is planned in Phase I, a 300-metre berth in Phase 2 and another 300-metre berth in Phase 3. Once the port becomes fully operational, Azhikkal port will handle even internationally plying ships of around 4500 TEU Panamax vessels with a dredged depth of around 14.5m in the harbour basin. The port can handle containers, liquid bulk, petroleum products, dry bulk and break-bulk cargos.
Inland Water Transport
Inland Water Transport is fast emerging as a viable supplementary mode for movement of passengers and goods. It is considered cost-effective and ecofriendly mode of transport. Any disruption in the rail/ road transport not only creates hardships to passengers and movement of goods but also put a hold on the economic growth of the country. Hence, it becomes all the more necessary to develop and promote IWT sector. In the year 2022-23, cargo movement on National Waterways was 91.60 Metric Tonne (MMT) as compared to 76.65 MMT in 2021-22, showing a growth of 19.5 per cent India.
In the year 2023-24, cargo movement on National Waterways was 133.03 Million Metric Tonne (MMT) as compared to 126.15 MMT in 2022-23, showing a growth of 5.5 per cent (Source: Ministry of Ports, Shipping and Waterways, Government of India). The Maritime India Vision (MIV) 2030 document sets a target of 200 MMT for cargo movement through national waterways by 2030.
National Waterways in Kerala
As part of a programme for developing waterways by the Central Government, the portion of West Coast Canal (WCC) from Kollam to Kottapuram and Udyogamandal and Champakara Canals were declared as National Waterway 3 in 1993. The NW-3 is now extended up to Kozhikode by the National Waterway Act 2016.After the National waterway Act 2016; three canals were added to National Waterways under class 3 specification of 2.20m draught, 6.0m vertical clearance and 32- 40m width. National Water Ways in Kerala are given below:
National Water Ways in Kerala
|
Sl.No
|
Route
|
Length (in km)
|
NW No.
|
|
1
|
Kollam-Kottapuram portion of WCC
|
168
|
NW-3
|
|
Udyogamandal canal
|
37
|
|
Champakara canal
|
14
|
|
Kottappuram-Kozhikkode portion of WCC
|
160
|
|
2
|
Alappuzha-Changanassery
|
28
|
NW-8
|
|
3
|
Alappuzha-Kottayam-Athirampuzha
|
38
|
NW-9
|
|
4
|
Kottayam-Vaikkam
|
28
|
NW-59
|
|
5
|
Poovar-Erayumanthurai-AVM canal (Major portion in TN)
|
|
NW-58
|
|
Total Length (excluding AVM canal)
|
473 km
|
|
Source: Inland Water Ways Authority, Kochi
|
Total length of WCC is 616 km. There are 1,100 km feeder and link canals connecting WCC and important destinations like commercial centres, ports and tourism spots. WCC can broadly be divided into five sections namely (1) Kovalam- Kollam (74.18 km), (2) Kollam-Kottappuram (Kodungallur) (168 km), (3) Kottappuram- Kozhikode (160 km), (4) Kozhikode-Neeleswaram (187.82 km) and (5) Neeleswaram-Bekal (26 km) respectively. Out of the total length of 616 km, three portions between Mahe and Valapattanam having total length of 26 km are uncut portions. Further extension for 41 km from Neeleswaram to Kasaragod is also under consideration.
Infrastructure - Transport Statistics 2006-23
Source:
* Economic Review 2024
* Motor Vehicle Department
* Department of Economics and Statistics, Kerala