|
District wise Patients treated for Fever during 2022 and 2023
(up to August 31) (Nos.)
|
|
Sl No
|
District
|
Fever
|
|
2022
|
2023
(Upto August 31)
|
|
1
|
Thiruvananthapuram
|
293071
|
174976
|
|
2
|
Kollam
|
164975
|
108903
|
|
3
|
Pathanamthitta
|
77286
|
56940
|
|
4
|
Alappuzha
|
189957
|
122994
|
|
5
|
Kottayam
|
183289
|
97398
|
|
6
|
Idukki
|
85477
|
54117
|
|
7
|
Ernakulam
|
292205
|
136090
|
|
8
|
Thrissur
|
188755
|
99805
|
|
9
|
Palakkad
|
249953
|
162041
|
|
10
|
Malappuram
|
436684
|
291696
|
|
11
|
Kozhikode
|
398440
|
225637
|
|
12
|
Wayanad
|
164751
|
117941
|
|
13
|
Kannur
|
330442
|
182045
|
|
14
|
Kasaragod
|
230107
|
121190
|
|
Kerala
|
3285392
|
1951773
|
|
Source: Directorate of Health Services
|
Malaria:
Malaria, a vector borne disease transmitted by Anopheles mosquitoes, has been a major public health challenge for our country for the past many decades. Various national programmes targeting its elimination have met with limited success. Though Kerala had eliminated the disease in early 1970s, Malaria incidents still exist as a public health challenge. The problem has recently aggravated because of the presence of large scale population movement from malaria endemic States. Proportion of falciparum malaria, the more severe form of the disease also exists in Kerala. Though elimination of indigenous form of Malaria has been included in the SDG targets by the State, the issues in its fulfillment are many. Rapid urbanisation, extensive infrastructure development in many districts, uncontrolled construction works in urban area and climate related changes in life cycle of mosquitoes are all big hurdles in the attainment of the SDG goals. Annual cases of malaria in Kerala are less than 500 and the number of deaths reported is also very low. Kasaragod District is persistently having high number of malaria cases, over many years, because of its proximity to the highly endemic districts of Karnataka. Movement of fishermen along the western coast of our State is a potential threat for spread of malaria along the coastal districts. In 2022 number of cases reported was 438 and death reported was zero. In 2023, upto August, 272 cases and 4 death were reported. Number of cases and death from 2019 to 2023 (August 31) is given below:
|
Name of Diseases
Case
|
2019
|
2020
|
2021
|
2022
|
2023(Upto Aug 31)
|
|
Case
|
Death
|
Case
|
Death
|
Case
|
Death
|
Case
|
Death
|
Case
|
Death
|
|
Malaria
|
656
|
1
|
267
|
1
|
309
|
1
|
438
|
0
|
272
|
4 |
|
Source: Directorate of Health Services
|
Japanese Encephalitis (JE):
This is a form of encephalitis, an inflammatory disease of brain and its coverings, and is also a mosquito borne infection. Kerala is more prone to this disease because of the presence of large paddy fields as the virus responsible for the disease is spread by Culex mosquitos, which breed abundantly in water logged areas of paddy fields. The peculiar nature of the Culex mosquito to breed in contaminated water increases the potential threat in other areas as well. Role of migratory birds in transmission of JE is an extra risk for Kerala, because our State has many sanctuaries for migratory birds. But since there is an effective vaccine against JE, we can be optimistic in its control programme, by strengthening the JE vaccination. In 2022, two cases and zero death were reported. Four cases and one death have been reported in 2023 (up to August 31). Details of cases and death from 2019 to August 31, 2023 are given below:
|
Name of Diseases
Case
|
2019
|
2020
|
2021
|
2022
|
2023(Upto Aug 31)
|
|
Case
|
Death
|
Case
|
Death
|
Case
|
Death
|
Case
|
Death
|
Case
|
Death
|
|
Japanese Encephalitis (JE)
|
11
|
2
|
0
|
0
|
0
|
0
|
2
|
0
|
4
|
1
|
|
Source: Directorate of Health Services
|
Water Borne Diseases:
The main reason for waterborne diseases is attributed to the unavailability of safe drinking water in many parts of the District especially in tribal and coastal areas. Unhygienic drinking water sources such as wells, pump houses, water supplied through tanker lorry, leaks in public water supply pipes and the consequent mixing of foul water with drinking water, dumping of waste including sewage in water sources, use of commercial ice in preparation of cool drinks and using unsafe water in preparation of welcome drinks are some reasons for spread of water borne diseases. Health Department is implementing a programme called “Jagratha” from November 2017 for prevention and control of communicable diseases. There has been a considerable increase in incidents of typhoid in Kerala since 2020. Details of cases and death due to water borne diseases of Acute Diarrhoeal Diseases (ADD), typhoid and Hepatitis from 2019 to 2023 August 31 are given below:
|
Prevalence of water borne diseases in Kerala
|
|
Name of Diseases
Case
|
2019
|
2020
|
2021
|
2022
|
2023(Aug 31)
|
|
Case
|
Death
|
Case
|
Death
|
Case
|
Death
|
Case
|
Death
|
Case
|
Death
|
|
Hepatitis-A
|
1620
|
7
|
464
|
2
|
114
|
0
|
231
|
2
|
326
|
2
|
|
Cholera
|
9
|
0
|
2
|
0
|
1 |
0
|
0
|
0
|
24
|
0
|
|
Typhoid
|
27
|
0
|
16
|
0
|
30
|
0
|
55
|
0
|
78
|
0
|
|
ADD (Diarrhoea)
|
544027
|
6
|
250788
|
1
|
238227
|
3
|
466211
|
2
|
350037
|
2
|
|
Source: Directorate of Health Services
|
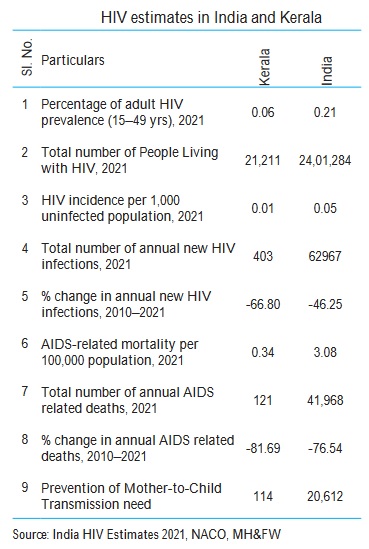
HIV/AIDS:
Kerala State Aids Control Society is the pioneer organisation in the State working with the objective of controlling the spread of HIV as well as strengthening the State’s capacity to respond to HIV/AIDS. The society was formed to implement National Aids Control Programme in the State. The prevalence rate in the State has declined from 0.21 per cent in 2008-09 to 0.13 in 2010-11 and 0.06 per cent in 2021. The prevalence rate in India in 2021 is 0.21 per cent. In Kerala, the prevalence of HIV/AIDS is 0.41 per cent (4.95 per cent in 2011) among injecting drug users (IDU) which is 6.26 per cent at the National-level. It is 0.23 per cent (0.36 per cent in 2011) among men having sex with men (MSM) which is 2.69 per cent at the National-level and 0.10 per cent (0.73 per cent in 2011) among Female Sex Workers (FSW) which is 1.56 per cent in India in 2017. Among transgender persons, HIV prevalence rate in Kerala is 0.16 per cent which is 3.14 per cent at the National-level. HIV prevalence among migrants in India is 0.51 per cent. HIV estimates in India and Kerala based on India HIV Estimates 2021 are given below:
Coronavirus Disease (COVID-19):
The first case of COVID-19 in India was reported in Kerala on January 30, 2020. Kerala adopted a multi-pronged strategy in dealing with the pandemic even before the first Covid-19 confirmed case was reported. In fact, Kerala’s response to Covid-19 started much earlier than March 11, 2020, when the Director General of the World Health Organisation (WHO) characterized Covid-19 as a pandemic. The containment strategies were well in place when the first case was reported. From the beginning of Covid-19 control activities, the private hospital engagement team was working in close liaison with the district private hospital engagement nodal officers, private hospital managements and Indian Medical Association. Kerala Medical Services Corporation Limited has played the most critical role in the ambulance services by managing the Kaniv-108 ambulances to mobilise the Covid-19 suspects/patients from their houses/exit points to the isolation facilities. During the corona virus outbreak in Kerala, it was decided to provide psycho social support ‘Ottakkalla Oppamundu’ to the persons in quarantine/isolation and their family members. State level trainings were conducted exhaustively and elaborately covering all staff working in the health sector. Ward level teams were active in all Panchayats and were ensuring daily calls and visits to the homes of the elderly. A series of mass media campaigns were being conducted for Covid-19 awareness from the beginning of 2020 itself. Health Department launched e-Sanjeevani telemedicine services in Kerala on June 10, 2020. They were providing services in a centralized manner and DISHA is the States hub managing the telemedicine activities for the State.
Non-Communicable Diseases (NCD):
Common non-communicable diseases causing great threat to a healthy life are diabetes, hypertension, cardio vascular diseases, cancer and lung diseases. Unless interventions are made to prevent and control non-communicable diseases, their burden is likely to increase substantially in future because of ageing population and changes in life style. Considering the high cost of medicines and longer duration of treatment, this constitutes a greater financial burden for low income groups. Rapid urbanisation, drastic lifestyle changes, heavy dependency on alcohol and tobacco, affinity for white collar jobs, unhealthy eating patterns, low priority for physical exertion, high levels of stress in all strata of population are some of the reasons contributing to the prevalence of non-communicable diseases in the State.
Incidents of obesity, hyper lipedemia, heart attack and stroke are also high. Cancer mortality is extremely high among males in Kerala compared to national average. A survey conducted by Achutha Menon Centre for Health Science Studies, Thiruvananthapuram reveals one out of three has hypertension and one out of five has diabetes. The study also revealed that the level of normalcy attained for blood sugar and blood pressure even after early detection and management is significantly low compared to the standards.
Even though the State has witnessed a steep decrease in the use of tobacco in the Global Adult Tobacco Survey 2016 with the prevalence dipping to 12 per cent from 21 per cent, the increasing consumption of alcohol is affecting the health sector with prevalence rate as high as 44 per cent and age of starting coming down every year. The unhealthy dietary practices and lack of physical exercise in all sections of the population irrespective of the age and economic status has contributed to the rise in lifestyle diseases resulting in 52 per cent of total deaths in the productive age group between 30 and 70 being due to one or other cause of NCD.
(Source: DHS)
Prevalence of Anaemia:
The findings of the NFHS-5 (2019-2021) reveal that there has been an increase in the prevalence of anaemia among women and children compared to NFHS-4, 2015-16. Kerala is the only State to have recorded a prevalence of less than 40 per cent in all targeted age groups. Anaemia Mukt Bharat (AMB) strategy was launched in 2018 with the objective of reducing anaemia prevalence among children, adolescents and women in reproductive age group. Anemia Free Kerala aims to strengthen the existing mechanisms imparted as part of Anemia Mukth Bharth and foster State specific newer strategies for tackling anaemia. Details of Anaemia prevalence in Kerala as per NFHS-5 compared to NFHS-4 is given below:
Anaemia prevalence in Kerala as per NFHS-5 compared to NFHS-4
|
Indicator
|
NFHS-4
|
NFHS-5
|
|
Children age 6-59 months who are anaemic (<11.0 g/dl) 22 (%) percentage of children in the said age group with a haemoglobin concentration less than 11 g/dL
|
35.7
|
39.4
|
|
Non-pregnant women age 15-49 years who are anaemic (<12.0 g/dl) 22 (%)
|
34.7
|
36.5
|
|
Pregnant women age 15-49 years who are anaemic (<11.0 g/dl) (%) percentage of women with a haemoglobin concentration less than 11 g/dL
|
22.6
|
31.4
|
|
All women age 15-49 years who are anaemic (%)percentage of women with a haemoglobin concentration less than 12 grams per decilitre (g/dL)
|
34.3
|
36.3
|
|
All women age 15-19 years who are anaemic 22 (%)
|
37.8
|
32.5
|
|
Men age 15-49 years who are anaemic (<13.0 g/dl) 22 (%)
|
11.8
|
17.8
|
|
Men age 15-19 years who are anaemic (<13.0 g/dl) 22 (%)
|
14.3
|
27.4
|
|
Source: National Family Health Survey
|
Cancer :
Cancer is a major non communicable disease in Kerala. Apart from Medical Colleges, Regional Cancer Centre, Malabar Cancer Centre and Cochin Cancer Research Centre are the major hospitals in Government sector which offer treatment for cancer patients. Apart from these institutions all the major Government hospitals provide cancer treatment. Delay in early detection, huge treatment cost, minimal treatment centres and lack of awareness contribute to high mortality of the disease.
Health Care Institutions:
In Kerala modern medical services are offered by the Directorate of Health Services (DHS) and the concerned education sector is dealt by the Directorate of Medical Education (DME).
Health Care Institutions under DHS:
At present there are 1,288 health institutions with 38525 beds, 6537 doctors, 14377 nursing staff and 7305 paramedical staff under Health Services Department consisting of 849 PHC/FHCs, 226 CHCs/Block FHCs, 87 taluk headquarters hospitals, 18 District hospitals, 18 general hospitals, 3 mental health hospitals, 10 women and children hospitals, 3 leprosy hospitals, 14 TB hospitals, 2 other speciality hospitals and 58 other hospitals. PHCs/ FHCs are institutions providing comprehensive primary care services including preventive care and curative care. CHCs/ Block FHCs and taluk level institutions form the basic secondary care institutions. District hospitals, general hospitals and maternity hospitals provide speciality services and some super speciality services. Category-wise major medical institutions and beds in Kerala, details of IP and OP cases, major and minor surgeries conducted DHS during 2022-23 and 2023-24 and medical and paramedical personnel under DHS are given here. Table 1, Table 2, Table 3.
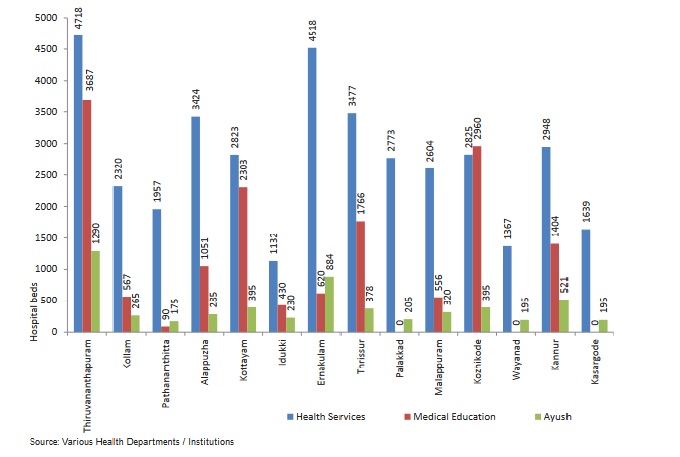
District-wise Distribution of Hospital Beds in Kerala:
District wise distribution of hospital beds in Kerala is given in Figure 6.2.1 Thiruvananthapuram and Ernakulam districts have higher number of beds as compared to other districts while Kasaragod, Idukki and Wayanad districts have lesser number of beds. The bed population ratio in Kerala is 1:604 and it is 1:668 for modern medicine alone. The average doctor bed ratio in Kerala is 1:4 and it is 1:5 for modern medicine alone. Doctor population ratio in Kerala is 1:2630. Population here is estimated for the year 2021. These figures are reflecting the status of government sector only and the figures will be much better if private sector is also considered.
District-wise Distribution of Hospital Beds in Kerala
Comparative Analysis of Major Communicable Diseases 2009-22
NOROVIRUS INFECTION
Health Indicators Definitions
⇒ Prevalence of principal communicable diseases during 2013-2017(up to October)
⇒ 100 Core Health Indicators 2015
⇒ 100 Core Health Indicators 2018
Source: Economic Review 2011-2023