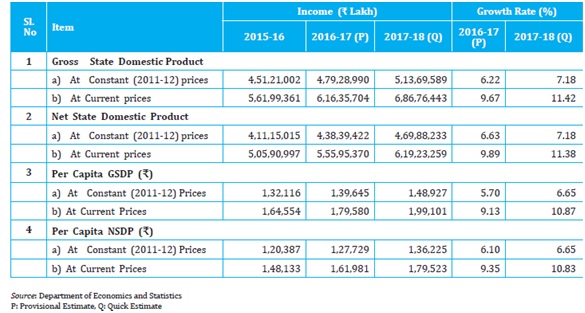
The quick estimate of Gross State Domestic Product (GSDP) at constant (2011-12) prices is ₹5,13,69,589 lakh in 2017-18 as against the provisional estimate of ₹4,79,28,990 lakh in 2016-17, registering a growth rate of 7.18 per cent in 2017-18 compared to 6.22 percent in 2016-17. The details are shown below diagrammatically. At current prices, the GSDP is estimated at ₹6,86,76,443 lakh (quick estimate) in 2017-18 as against the provisional estimate of ₹6,16,35,704 lakh in 2016-17 showing a growth rate of 11.42 per cent.
The quick estimate of Net State Domestic Product (NSDP) at factor cost at constant prices (2011-12) is ₹4,69,88,233 lakh in 2017- 18 compared to the provisional estimate of ₹4,38,39,422 lakh in 2016-17, recording a growth rate of 7.18 per cent in 2017-18. At current prices, the NSDP is estimated at ₹6,19,23,259 lakh (quick estimate) in 2017-18 compared to the provisional estimate of ₹5,55,95,370 lakh in 2016-17. The growth rate of NSDP at current prices is 11.38 per cent in 2017-18 compared to 9.89 per cent in 2016-17. Details are given in Table below:
.jpg)
Growth rate of GSDP at constant prices 2011-12, Kerala, in per cent
State domestic product and per capita income of Kerala
The quick estimate of Gross State Domestic Product (GSDP) at constant (2011-12) prices is ₹5,59,41,196 lakh in 2018-19 as against the provisional estimate of ₹5,20,57,851 lakh in 2017-18, registering a growth rate of 7.5 per cent in 2018-19 compared to 7.3 per cent in 2017-18. At current prices, the GSDP is estimated at ₹7,81,65,326 lakh (quick estimate) in 2018-19 as against the provisional estimate of ₹7,01,57,738 lakh in 2017-18, showing a growth rate of 11.4 per cent.
The quick estimate of Gross State Value Added (GSVA) at constant (2011-12) prices is ₹5,00,08,120 lakh in 2018-19 as against the provisional estimate of ₹4,65,14,275 lakh in 2017-18, leading to a growth rate of 7.5 per cent in 2018-19 compared to 6.8 per cent in 2017-18. Details are given in the below Table and figure.
Annual rates of growth of GSVA for Kerala and GVA for India (both at constant 2011-12 prices), in per cent

Source: Department of Economics and Statistics (for Kerala) and National Accounts Statistics (for India)
State Domestic Product and per capita income of Kerala

(Source: Department of Economics and Statistics; P: Provisional Estimate, Q: Quick Estimate)
Per Capita State Income: As per the quick estimates in 2013-14, the per capita Gross State Domestic Product at constant (2004-05) prices was Rs. 66862 as against provisional estimate of Rs. 63227 in 2012-13, recording a growth rate of 5.7 percent in 2013-14. At current prices, the per capita GSDP in 2013-14 was Rs. 117132 registering a growth rate of 13.36 percent over the previous year’s estimate of Rs. 103321. The best indicator of per capita state income is NSDP (which indicates value added within the state) divided by the population. At constant (2004-05) prices, the quick estimates of per capita Net State Domestic Product in 2013-14 was Rs. 58961 as against provisional estimate of Rs. 55643 in 2012-13, recording a growth rate of 5.9 percent in 2013-14. The below figure shows that during the period 2007-08 to 2013-14, the per capita state income at constant prices was higher than the per capita national income.
As per the quick estimates, the per capita Gross State Domestic Product at constant (2011-12) prices in 2014-15 was ₹127166 as against provisional estimate of ₹119799 in 2013-14, recording a growth rate of 6.15 percent in 2014-15. At current prices, the per capita GSDP in 2014-15 was ₹152912 compared to ₹136827 in 2013-14. The best indicator of per capita state income is NSDP divided by the population. At constant (2011-12) prices, the quick estimates of per capita Net State Domestic Product in 2014-15 was ₹115225 as against provisional estimate of ₹108147 in 2013-14, recording a growth rate of 6.54 percent in 2014-15. The figure below shows that during the period 2012-13 to 2014-15, the per capita state income at constant prices was higher than the per capita national income by over 50 percent.The details are given here.
As per the quick estimates, the per capita GSDP at constant (2011-12) prices in 2015-16 was Rs.136,811 as against provisional estimate of Rs.127,187 in 2014-15, recording a growth rate of 7.57 percent in 2015-16. At current prices, the per capita GSDP in 2015-16 was Rs.172,268 registering a growth rate of 11.30 percent over the previous year’s estimate of Rs.154,778. The best indicator of per capita state income is NSDP divided by the population. At constant (2011-12) prices, the quick estimates of per capita Net State Domestic Product in 2015-16 was Rs.124,773 as against provisional estimate of Rs.115,848 in 2014-15, recording a growth rate of 7.70 percent in 2015-16. The figure shown below during the period 2012-13 to 2015-16, the per capita state income at constant prices was higher than the per capita national income.
(3).jpg)
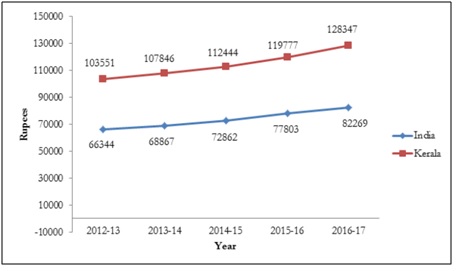
As per the quick estimates, the per capita GSDP at constant (2011-12) prices in 2016-17 was 140,107 as against the provisional estimate of 131,086 in 2015-16, recording a growth rate of 6.88 per cent in 2016-17. At current prices, the per capita GSDP in 2016-17 was 179,778 registering a growth rate of 10.04 per cent over the previous year’s estimate of 163,369. The best indicator of per capita State income is NSDP divided by the population. At constant (2011-12) prices, the quick estimates of per capita NSDP in 2016-17 was 128,347 as against provisional estimate of 119,777 in 2015-16, recording a growth rate of 7.15 per cent in 2016-17. Figure 1.4 shows that during the period 2012-13 to 2016-17, the per capita State income at constant prices was higher than the per capita national income.
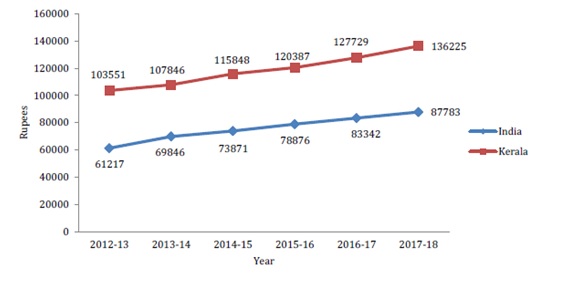
As per the quick estimates, the per capita GSDP at constant (2011-12) prices in 2017-18 was ₹1,48,927 as against the provisional estimate of ₹1,39,645 in 2016-17, recording a growth rate of 6.65 percent in 2017-18. At current prices, the per capita GSDP in 2017-18 was ₹1,99,101 registering a growth rate of 10.87 percent over the previous year’s estimate of ₹1,79,580. At constant (2011-12) prices, the quick estimates of per capita NSDP in 2017-18 was ₹1,36,225 as against the provisional estimate of ₹1,27,729 in 2016-17, recording 6.65 percent growth in 2017-18. The figure below shows that between 2012-13 and 2017-18, the per capita NSDP at constant prices was higher than the per capita NSDP at all India level.
Per capita NSDP and per capita NDP at constant 2011-12, prices in ₹
Source: Central Statistics Office and Department of Economics and Statistics
NSDP- Net State Domestic Product, NDP- Net Domestic Product
As per the quick estimates, the per capita GSDP at constant (2011-12) prices in 2018-19 was ₹1,61,374 as against the provisional estimate of ₹1,50,922 in 2017-18, recording a growth rate of 6.9 per cent in 2018-19. At current prices, the per capita GSDP in 2017-18 was ₹2,25,484 registering a growth rate of 10.9 per cent over the previous year’s estimate of ₹2,03,396. At constant (2011-12) prices, the quick estimates of per capita NSDP in 2018-19 was ₹1,48,078 as against the provisional estimate of ₹1,38,368 in 2017-18, recording 7.0 per cent growth in 2018-19. The figure mentioned below shows that between 2012-13 and 2018-19, the per capita NSDP at constant prices was higher than the per capita NSDP at all India level.
Per capita NSDP and per capita NDP at constant 2011-12, prices in ₹

Source: Central Statistics Office and Department of Economics and Statistics
NSDP- Net State Domestic Product, NDP- Net Domestic Product
State Domestic product and per capita Income of Kerala
Sectoral Distribution of Gross State Domestic Product: The contribution from primary, secondary and tertiary sectors to the GSDP in 2010-11 at constant prices (2004-05) was 11.06%, 20.13% and 68.80%, respectively. At current prices, the same was 14.94 %, 21.08% and 63.98%, respectively. During 2012-13, the contribution from primary, secondary and tertiary sectors to the GSDP at constant prices (2004-05) was 9.3%, 23.9% and 66.7% respectively. At current prices, the primary, secondary and tertiary sectors contributed 15.1%, 25% and 59.9% respectively to the GSDP during 2012-13. This difference in sectoral share between constant and current prices shows that inflationary trends in the primary sectors are much higher than in the secondary and tertiary sector. The details are given here.
During 2013-14, the contribution from primary, secondary and tertiary sectors to the GSDP at constant prices (2004-05) was 9.2 percent, 19.9 percent and 70.9 percent respectively. At current prices, the primary, secondary and tertiary sectors contributed 14.2 percent, 19.7 percent and 66.1 percent respectively to the GSDP during 2013-14 (Figure below). This difference in sectoral share between constant and current prices shows that inflationary trends in the primary sectors are much higher than in the secondary and tertiary sector.
During 2014-15, the contribution from primary, secondary and tertiary sectors to the GSVA at constant prices (2011-12) was 12.15 percent, 25.11 percent and 62.74 percent respectively. At current prices, the primary, secondary and tertiary sectors contributed 12.91 per cent, 24.81 percent and 62.28 percent respectively to the GSVA during 2014-15. This difference in sectoral share between constant and current prices shows that inflationary trends in the primary sectors are much higher than in the secondary and tertiary sector. The details are given here.
While analysing the sectoral distribution of state income for the year 2013-14, it is seen that the contribution from primary sector and secondary sector are decreasing. But tertiary sector is showing an increase of 70.9 percent from 69.1 percent. The analysis of annual sectoral growth rate of Gross State Domestic Product shows that tertiary sector recorded the highest rate of growth 8.95 percent in 2013-14 at constant (2004-05) prices followed by secondary sector (1.34 percent) and primary sector showed a negative growth rate of -1.36 percent. The driving factor for the growth of the tertiary sector is mainly the growth in the transport, storage and communication sector which is showing an increase to 16.78 percent in 2013-14 from 12.69 percent in 2012-13. Negative growth in agriculture is generally because of the decrease of production in some of the cash crops like pepper, turmeric, cashew, tea and coffee. At current prices, the tertiary sector recorded a growth rate of 17.68 percent, secondary sector 17.68 percent and primary sector with 7.5 percent in 2013-14. The details of sectoral distribution of GSDP with percentage during the last three years is given in [1, 2, and 3] and the details of GSDP, NSDP at constant and current prices during 2004-05 to 2012-13 are given at [4,5,6 and 7].
While analysing the sectoral distribution of state income for the year 2014-15, it is seen that the contribution from primary sector and secondary sector are decreasing. But tertiary sector is showing an increase to 62.75 percent from 60.89 percent. The analysis of annual sectoral growth rate of Gross State Valued Added shows that tertiary sector recorded the highest rate of growth 9.42 percent in 2014-15 at constant (2011-12) prices followed by secondary sector (3.74 percent) and primary sector showed a negative growth rate of -3.86 percent. The driving factor for the growth of the tertiary sector is mainly the growth in storage, trade, hotels and restaurant which is showing an increase of 14.72 percent in 2014-15 compared to 7.10 percent in 2013-14. Negative growth in agriculture is generally because of the decrease in production of some of the cash crops like pepper, turmeric, cashew, tea, coffee and rubber. At current prices, the tertiary sector recorded a growth rate of 14.43 percent, secondary sector 9.22 percent and primary sector with 6.13 percent in 2014-15.
The share of primary and secondary sector has decreased during the period 2012-13 to 2014-15 and tertiary sector has increased from 59.06% to 62.75%. The details of sectoral distribution of GSVA with percentage share during the last three years is given in 1, 2 and 3 and the details of GSDP, NSDP at constant and current prices during 2011-12 to 2014-15 are given 4, 5, 6, and 7.
Sectoral Distribution of GSDP - Kerala 1960, 2011, District wise distribution of Gross State Domestic Product 2012-2013 ,Sector wise Annual Growth Rate of GSDP -Kerala2008-2011
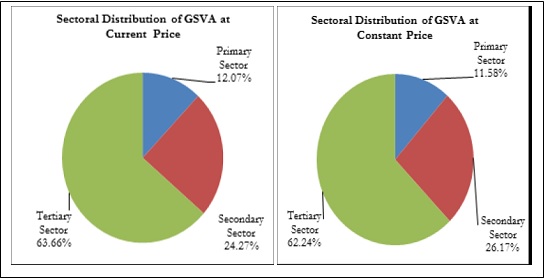
During 2015-16, the contribution from primary, secondary and tertiary sectors to the GSVA at constant prices (2011-12) was 11.58 percent, 26.17 per cent and 62.24 per cent respectively. At current prices, the primary, secondary and tertiary sectors contributed 12.07 per cent, 24.27 percent and 63.66 percent respectively to the GSVA during this period.The Sectoral Distribution of GSVA 2015-16 at Basic Prices, in per cent is shown below:
In 2015-16, at current prices, the contribution to GSVA of the tertiary sector increased to 63.66 percent from 61.53 percent in 2014-15. The contribution from primary and secondary sector declined from 13.45 percent to 12.07 percent in the primary sector, and from 25.02 percent to 24.27 percent in the secondary sector during the corresponding period. The analysis of annual sectoral growth rate of GSDP shows that the tertiary sector recorded the highest rate of growth 8.78 percent in 2015-16 at constant (2011-12) prices compared to 8.32 percent in 2014-15 followed by secondary sector (8.58 percent). The primary sector recorded a negative growth rate of -2.08 percent. Negative growth in agriculture was because of the decrease in production of some of the cash crops, and in fishing and aquaculture and forestry and logging.
The details of sectoral distribution of GSDP with percentage share during the last three years is given in fig1, fig2 and fig3 and the details of GSDP, NSDP at constant and current prices during 2011-12 to 2015-16 are given in fig 4-7.
At current prices, the tertiary sector recorded a growth rate of 14.94 per cent, secondary sector 7.73 per cent and primary sector 0.37 per cent in 2015-16 compared to the previous year. The driving force of growth in the tertiary sector is growth in the transport, storage, communication and service-related broadcasting, real estate, ownership of dwelling and professional services.
During 2016-17, the contribution from primary, secondary and tertiary sectors to the GSVA at constant prices (2011-12) was 11.27 percent, 25.59 per cent and 63.14 percent respectively. At current prices, the primary, secondary and tertiary sectors contributed 13.36 percent, 23.47 percent and 63.18 percent respectively to the GSVA during this period. The details are given below:
Sectoral Distribution of Gross State Value Added (GSVA) 2016-17 at Basic Prices
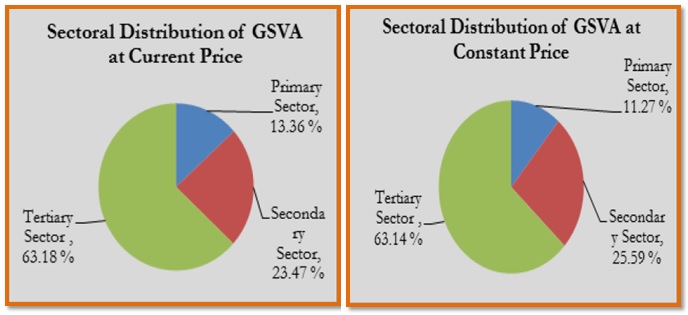
The contribution to GSVA (at current prices) of the tertiary sector and primary sector increased from 62.59 percent in 2015-16 to 63.18 percent in 2016-17, and from 12.82 percent in 2015-16 to 13.36 percent in 2016-17 respectively. During the corresponding period the contribution of secondary sector declined from 24.59 per cent to 23.47 percent.
The analysis of annual sectoral growth rate of GSDP shows that tertiary sector recorded the highest rate of growth of 6.7 percent in 2016-17 at constant (2011-12) prices followed by primary sector (5.19 percent) and tertiary sector 2.88 percent. During the period, the growth rate in primary sector increased from -11.2 percent to 5.19 mainly because of the increase in production of some of the crops, live stocks, fishing and aquaculture and mining and quarrying.
At current prices, the primary sector recorded a growth rate of 13.25 percent, tertiary sector 9.72 percent and secondary sector 3.74 percent in 2016-17. The driving force for the growth of the tertiary sector is mainly the growth in the Transport, storage, communication and service related broadcasting and public administration.
During the period 2013-14 to 2015-16, the share of contribution of tertiary sector has increased from 60.43 to 63.66 per cent. However, the share of primary sector decreased from 13.45 per cent to 12.07 per cent and secondary sector also decreased from 25.81 to 24.27 per cent during this period. The details of sectoral distribution of GSDP with percentage share during the last three years is given in [1, 2 and 3] and the details of GSDP, NSDP at constant and current prices during 2011-12 to 2015-16 are given at [4,5,6,and 7].
In 2017-18, the contribution from primary, secondary and tertiary sectors to the GSVA at constant prices (2011-12) was 10.85 per cent, 27.40 per cent and 61.75 per cent respectively. At current prices, the primary, secondary and tertiary sectors contributed 13.20 percent, 24.24 per cent, and 62.56 per cent respectively to the GSVA in this period. Details are given below:
Sectoral distribution of GSVA current and constant 2017-18 at basic prices, in per cent
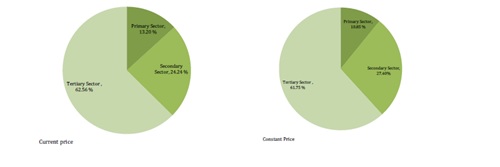
The contribution to GSVA (at current prices) of the tertiary sector and primary sector slightly increased from 62.35 per cent in 2016-17 to 62.56 percent in 2017-18 and from 13.14 percent in 2016-17 to 13.20 per cent in 2017-18. In the corresponding period, the contribution of the secondary sector declined from 24.51 to 24.24 per cent.
The contribution to GSVA (at current prices) of the tertiary sector and primary sector slightly increased from 62.35 per cent in 2016-17 to 62.56 per cent in 2017-18 and from 3.14 per cent in 2016-17 to 13.20 per cent in 2017-18. In the corresponding period, the contribution of the secondary sector declined from 24.51 to 24.24 percent.
The analysis of annual sectoral growth rate of GSDP shows that secondary sector recorded the highest rate of growth of 6.52 per cent in 2017-18 at constant (2011-12) prices followed by tertiary sector (5.84 per cent) and primary sector (5.09 per cent). At current prices, the tertiary sector grew 10.75 per cent, primary sector 10.88 per cent and secondary sector 9.14 per cent in 2017-18. The details of the sectoral distribution of GSVA in the last three years are given here.
The structure of the economy and the workforce in Kerala are noticeably different from the structure in the rest of India. Agriculture and allied activities employed 41.8 per cent of India’s total workforce even in 2017-18. However, in Kerala, there has been a large-scale withdrawal of workers from agriculture over the years, with the share of the workforce in agriculture and allied activities declining to only 16.7 per cent by 2017-18. The share of agriculture and allied activities in gross value added was 9.5 per cent and 14.9 per cent respectively in Kerala and India. The share of manufacturing in gross value added was only 12.8 per cent in Kerala, compared to 18.0 per cent in India as a whole. The details are given below:
Shares of different sectors in Gross Value Added and employment, Kerala and India, 2017-18
|
Sectors
|
Shares in Gross Value Added
|
Shares in employment
|
|
Kerala (GSVA)
|
India (GWA)
|
Kerala
|
India
|
|
Agriculture, livestock, forestry & fishing
|
9.5
|
14.9
|
16.7
|
41.8
|
|
Mining & quarrying
|
0.7
|
3.0
|
0.2
|
0.4
|
|
Primary
|
10.
2
|
17.9
|
16.9
|
42.2
|
|
Manufacturing
|
12.8
|
18.0
|
11.8
|
12.8
|
|
Electricity, gas, water supply & other utility services
|
1.1
|
2.2
|
0.4
|
0.7
|
|
construction
|
13.8
|
8.0
|
18.9
|
11.6
|
|
Secondary
|
27.7
|
28.2
|
31.1
|
25.1
|
|
Trade, repair, hotels & restaurants
|
17.5
|
12.6
|
17.7
|
12.6
|
|
Transport, storage, communication & services related to broadcasting
|
7.7
|
6.5
|
11.1
|
6.2
|
|
Financial, real estate& professional services
|
21.1
|
21.9
|
7.1
|
3.6
|
|
Public Administration & other services
|
15.8
|
12.9
|
16.0
|
10.4
|
|
Tertiary
|
62.1
|
53.9
|
51.9
|
32.8
|
|
|
100
|
100
|
100
|
100
|
|
Sources: Department of Economics & Statistics (for GSVA of Kerala) and National Accounts Statistics (for GVA of India) and Periodic Labour Force Survey (PLFS) carried out by India’s Central Statistical Office in 2017-18 for data on employment.
|
At the same time, the contribution by construction and the services sectors to the economy are bigger in Kerala than in the rest of India. In 2017-18, the share of the construction sector to gross value added was 13.8 per cent and 8.0 per cent respectively in Kerala and India. The services sector accounted for 62.1 per cent of the gross value added and 51.9 per cent of the total workforce of Kerala in 2017-18. At the national level, the share of the service sector to gross value added and employment were 53.9 per cent and 32.8 per cent respectively.
District wise distribution of Gross State Domestic Product :
District wise distribution of Gross State Domestic Product at factor cost at current prices shows that Ernakulam District continues to have the highest income of Rs. 5409716 lakhs in 2013-14 as against Rs. 4800385 lakhs in 2012-13 registering a growth rate of 12.7 percent. At constant (2004-05) prices, this amounts to Rs. 3264509 lakhs during 2013-14 compared to Rs. 3076050 lakhs during 2012-13. The details are given here.
District wise distribution of Gross State Value Added at basic prices at current prices shows that Ernakulam District continues to have the highest income of ₹7308907 lakhs in 2014-15 as against ₹ 6494347 lakhs in 2013-14 registering a growth rate of 12.54 percent. At constant (2011-12) prices, this amounts to ₹6081130 lakhs during 2014-15 compared to ₹5680292 lakhs during 2013-14. The district wise details are given here.
District-wise distribution of GSVA at current prices shows that Ernakulam district continues to have the highest income of Rs.6,811,532 lakhs in 2015-16 as against Rs.6,042,283 lakhs in 2014-15 registering a growth rate of 12.73 percent. At constant (2011-12) prices, this amounts to Rs.5,489,638 lakhs during 2015-16 compared to Rs.5,061,012 lakhs during 2014-15. The district-wise GSVA details are given below:
(2).jpg) Source: Department of Economics and Statistics P: Provisional Estimate Q: Quick Estimate
Source: Department of Economics and Statistics P: Provisional Estimate Q: Quick Estimate
District-wise distribution of GSVA at basic price at current prices shows that Ernakulam District continues to have the highest income of 6,918,835 lakh in 2016-17 as against 6,296,547 lakh in 2015-16 registering a growth rate of 9.88 per cent. At constant (2011-12) prices, this amounts to 5,491,752 lakh in 2016-17 compared to 5,125,647 lakh in 2015-16. The district wise GSVA details are given below:
District-wise Distribution of Gross State Value Added
|
Sl. No
|
District Name
|
Gross State Value Added at Basic Price ( in lakh)
|
|
|
At Current Prices
|
At Constant Prices (2011-12)
|
|
|
2015-16
(P)
|
2016-17
(Q)
|
Growth Rate (%)
|
2015-16
(P)
|
2016-17
(Q)
|
Growth Rate (%)
|
|
1
|
Trivandrum
|
5,119,355
|
5,567,163
|
8.75
|
4,087,733
|
4,311,759
|
5.48
|
|
2
|
Kollam
|
4,568,252
|
4,980,196
|
9.02
|
3,622,737
|
3,825,637
|
5.60
|
|
3
|
Pathanamthitta
|
1,438,255
|
1,599,967
|
11.24
|
1,135,630
|
1,218,492
|
7.30
|
|
4
|
Alappuzha
|
3,650,842
|
3,959,161
|
8.45
|
2,922,450
|
3,069,069
|
5.02
|
|
5
|
Kottayam
|
3,021,186
|
3,273,951
|
8.37
|
2,504,602
|
2,627,009
|
4.89
|
|
6
|
Idukki
|
1,895,868
|
2,056,010
|
8.45
|
1,453,150
|
1,485,762
|
2.24
|
|
7
|
Ernakulam
|
6,296,547
|
6,918,835
|
9.88
|
5,125,647
|
5,491,752
|
7.14
|
|
8
|
Thrissur
|
5,178,400
|
5,561,292
|
7.39
|
4,144,093
|
4,343,482
|
4.81
|
|
9
|
Palakkad
|
3,717,274
|
3,998,133
|
7.56
|
2,904,804
|
3,034,377
|
4.46
|
|
10
|
Malappuram
|
4,896,021
|
5,363,418
|
9.55
|
3,889,842
|
4,144,456
|
6.55
|
|
11
|
Kozhikode
|
4,395,664
|
4,681,302
|
6.50
|
3,491,034
|
3,633,201
|
4.07
|
|
12
|
Wayanad
|
1,029,524
|
1,107,058
|
7.53
|
770,726
|
802,474
|
4.12
|
|
13
|
Kannur
|
3,509,232
|
3,866,359
|
10.18
|
2,823,432
|
3,027,512
|
7.23
|
|
14
|
Kasaragod
|
1,718,063
|
1,889,926
|
10.00
|
1,359,393
|
1,443,907
|
6.22
|
|
GSVA
|
50,434,483
|
54,822,771
|
8.70
|
40,235,273
|
42,458,889
|
5.53
|
|
Source: Department of Economics and Statistics, (P: Provisional Q:Quick
|
District-wise distribution of GSVA at the basic price at current prices shows that Ernakulam District continues to have the highest income of ₹74,86,789 lakh in 2017-18 as against ₹69,04,548 lakh in 2016-17, registering a growth rate of 8.43 percent. At constant (2011-12) prices, this amounts to ₹56, 82,082 lakh in 2017-18 compared to ₹54, 35,176 lakh in 2016-17. The District-wise GSVA details are given in table below:
.jpg)
District-wise Per Capita Income:
The analysis of district wise per capita income shows that Ernakulam district stands first with the per capita income of Rs. 85070 at constant (2004-05) prices in 2010-11 as against Rs. 78351 in 2009-10 Kottayam District has the second largest per capita income of Rs. 64648 in 2010-11 at constant prices followed by Thiruvananthapuram ( Rs.60945), Pathanamthitta ( Rs. 60370), Thrissur ( Rs. 59127), and Alappuzha ( Rs. 57298). The lowest per capita income was recorded in Malappuram District ( Rs. 36740) in 2010-11 at constant prices preceded by Wayanad ( Rs. 39051), Kasargod ( Rs. 44572) and Kozhikode ( Rs. 53298). The highest rate of growth of per capita income of 9.31% was recorded in Pathanamthitta District in 2010-11 followed by Thiruvananthapuram (8.98 %), Thrissur (8.84%), Ernakulam (8.57%), and Allappuzha (8.37%). The lowest growth rate was recorded in Idukki District (6.84%) preceded by Wayanad District (7.74%) , Malappuram (7.75%), and Kasargod (7.97 %). The district wise per capita income with growth rate is given here:
The analysis of district wise per capita income shows that Ernakulam district stands first with the per capita income of Rs.86267 at constant (2004-05) prices in 2013-14 as against Rs. 81557 in 2012-13. The district wise per capita income with corresponding rank and growth rate is given here. [Tables showing state income(2007 -2010) District wise per capita Income at constant (2004-2005)]
Growth rate at current prices does not eliminate the inflationary impact. When district level growth rate at constant prices, we compared the “real” GSDP growth rate may be observed as the inflationary impact has been eliminated. Ernakulam, Thrissur,Kozhikode and Kannur had higher real growth in GSDP than the State Average. Wayanad had a lower growth than other districts. According to Department of Economics & Statistics, t analysis of district wise per capita income shows that Ernakulam district stands first with the per capita income of Rs 94392 at constant (2004-05) prices in 2012-13. The details are shown here:
The table reveals that the districts Ernakulam, Thrissur, Kozhikode and Kannurhad a much higher growth rate than the average growth in per capita income in 2012-13. However, the districts of Wayanad, Kollam, Palakkadand Idukki showed much lower growth in per capita income than the state average. District wise and sector wise analysis of GSDP reveals that Ernakulam district contributions in all these sectors are highest. District-wise sectoral distribution of Gross State Domestic Product from 2010-11 to 2012-13 at current and constant (2004-2005) prices are given in 7,8, 9, 10, 11 and 12.
District wise and sectorwise analysis of GSDP reveals that Kollam district showed highest contributions in primary sector and Ernakulam district contributions in secondary and tertiary sectors are highest. District-wise sectoral distribution of Gross State Domestic Product from 2011-12 to 2013-14 at current and constant (2004-2005) prices are given in 1, 2, 3, 4,5 and 6.
The analysis of district per capita income shows that Ernakulam stands at the top with the per capita income of ₹161472 at constant (2011-12) prices in 2014-15 as against ₹151210 in 2013-14. The district wise per capita income with corresponding rank and growth rate is given here.
The data reveals that the districts Alappuzha, Idukki, Ernakulam, Thiruvananthapuram, Kollam, Malappuram, had much higher growth rates than the average growth in per capita income in 2014-15. However, the districts of Pathanamthitta, Kottayam, Kasaragod and Kannur showed lower growth in per capita income than the state average.
District wise and sector-wise analysis of GSVA reveals that contribution of Ernakulam in primary, secondary and tertiary sectors is the highest. District-wise sectoral distribution of Gross State Value Added from 2012-13 to 2014-15 at current and constant (2011-12) prices are given in[1.Gross District Value Added (At Basic Price) - Current Price2012-13, 2. Gross District Value Added (At Basic Price) - Constant Price2012-13, 3.Gross District Value Added (At Basic Price) - Current Price2013-14, 4. Gross District Value Added (At Basic Price) - Constant Price2013-14, 5. Gross District Value Added (At Basic Price) - Current Price2014-15, 6. Gross District Value Added (At Basic Price) - Constant Price2014-15]
The analysis of district wise per capita income shows that Ernakulum district continues to stands first with the per capita income of Rs.146,518 at constant (2011-12) prices in 2015-16 as against Rs.135,817 in 2014-15. The district wise per capita income with corresponding rank and growth rate is given below:
(4).jpg) Source: Department of Economics and Statistics P: Provisional Estimate Q: Quick Estimate
Source: Department of Economics and Statistics P: Provisional Estimate Q: Quick Estimate
The data reveals that Thiruvananthapuram, Kasaragod, Thrissur, Ernakulam, Kannur and Palakkad districts had a higher-than-average growth rate in per capita income in 2015-16. However, Pathanamthitta, Idukki, Kollam, Kottayam and Wayanad districts showed lower-than-average growth in per capita income.District-wise sectoral distribution of Gross State Domestic Product from 2012-13 to 2015-16 at current and constant (2011-12) prices are given in fig 8-13.
The analysis of district-wise per capita reveals that Ernakulam district continues to stands first with the per capita income of 162,297 at constant (2011-12) prices in 2016-17 as against 152,318 in 2015-16. The district wise per capita income with corresponding rank and growth rate is given below:
|
Sl. No.
|
District
|
2015-16 (P)
|
Rank
|
2016-17 (Q)
|
Rank
|
Growth Rate
(%)
|
|
1
|
Thiruvananthapuram
|
122,679
|
7
|
129,137
|
7
|
5.26
|
|
2
|
Kollam
|
136,282
|
3
|
143,638
|
2
|
5.40
|
|
3
|
Pathanamthitta
|
96,134
|
12
|
103,460
|
12
|
7.62
|
|
4
|
Alappuzha
|
136,804
|
2
|
143,542
|
3
|
4.92
|
|
5
|
Kottayam
|
126,238
|
6
|
132,267
|
6
|
4.78
|
|
6
|
Idukki
|
132,107
|
4
|
135,316
|
5
|
2.43
|
|
7
|
Ernakulam
|
152,318
|
1
|
162,297
|
1
|
6.55
|
|
8
|
Thrissur
|
129,922
|
5
|
135,518
|
4
|
4.31
|
|
9
|
Palakkad
|
100,128
|
10
|
103,855
|
11
|
3.72
|
|
10
|
Malappuram
|
89,357
|
14
|
94,012
|
14
|
5.21
|
|
11
|
Kozhikode
|
109,632
|
8
|
113,307
|
9
|
3.35
|
|
12
|
Wayanad
|
92,353
|
13
|
95,715
|
13
|
3.64
|
|
13
|
Kannur
|
109,602
|
9
|
116,982
|
8
|
6.73
|
|
14
|
Kasaragod
|
100,198
|
11
|
105,555
|
10
|
5.35
|
| |
Kerala
|
117,811
|
|
123,707
|
|
5.01
|
|
P: Provisional Q: Quick Source: Department of Economics and Statistics
|
The table reveals that Thiruvananthapuram, Kollam, Pathanamthitta, Ernkulam, Kannur, Kasargod, Malappuram, had a higher growth than the State average growth rate in per capita income in 2016-17. However, the districts of Alappuzha, Kottayam, Idukki, Thrissur, Palakkad, and Wayanad districts showed lower growth than the State average growth rate in per capita income. District wise and sectoral distribution of GSVA from 2014-15 to 2016-17 at current and constant (2011-12) prices are given in [8,9,10,11,12,13].
The analysis of District-wise per capita income reveals that Ernakulum District continues to stands first with the per capita income of ₹1,66,996 at constant (2011-12) prices in 2017-18 against ₹1,60,625 in 2016-17. The District-wise per capita income with corresponding rank and growth rate is given below:
.jpg)
The above table reveals that the Districts of Kollam, Alappuzha, Malappuram, Thiruvananthapuram, Wayanad had a much higher growth than the State average growth rate in per capita income in 2017-18. However, the Districts of Palakkad, Kozhikode, Ernakulam, Kottayam, Idukki, Thrissur, and Pathanamthitta Districts showed lower per capita income growth compared to the State average growth. District-wise and sectoral distribution of GSVA from 2015-16 to 2017-18 at current and constant (2011-12) prices are given here.
The analysis of District-wise per capita income reveals that Ernakulum District continues to stands first with the per capita income of ₹1,83,258 at constant (2011-12) prices in 2018-19 against ₹1,71,072 in 2017-18. The District wise per capita income with corresponding rank and growth rate is given below:
District-wise per capita Gross State Value Added at basic price, constant prices, 2011-12

The table above reveals that the Districts of Kottayam, Kannur, Kollam, Alappuzha, Thrissur, Ernakulam, and Kozhikode had a higher growth than the State average growth rate in per capita income in 2018-19. However, the Districts of Idukki, Thiruvananthapuram, Kasaragod, Malappuram, Palakkad, Pathanamthitta, and Wayanad showed lower per capita income growth compared to the State average growth. District-wise and sectoral distribution of GSVA from 2015-16 to 2017-18 at current and constant (2011-12) prices are given in [1,2,3,4,5 and 6]
Expenditure Pattern:
The major items of expenditure under revenue account are, pension, interest payments, salaries and devolutions to local bodies. The combined expenditure of social and economic services under revenue account constitutes the developmental expenditure. The collective expenditure of maintenance, expansion and development funds given to LSGD also needs to be reckoned as developmental expenditure. Expenditure on interest charges, pension charges, administrative services, police, etc. are the main components of non-developmental revenue expenditure. The ratio of revenue expenditure with relative to GSDP declined slightly to 13.07% in 2010-11 from 13.50% in 2009-10. The decline has been consistent since 2008-09. The share of developmental expenditure in total revenue expenditure marginally improved to 54.58% in 2010-11 from 53.43% in 2009-10. The developmental expenditure estimated in BE 2011-12 accounts for 59.37% of the total revenue expenditure. Trend in revenue expenditure is given here.
Public finances of Kerala entered into a crisis along with most other States in India during the second half of the 1990s, with revenue and fiscal deficits rising, Own Tax Revenue (OTR) and Central devolution declining and revenue expenditure, especially interest payments increasing. During the early years of 2000s, deficit targeting was attempted through passing legislation, namely, Fiscal Responsibility and Budget Management (FRBM) Act. To achieve the targets, expenditure compression was resorted to. This led to protests by sections of the society, who were adversely affected and the measures could not be continued beyond a very short period. Realising that the fiscal consolidation needs to be revenue led, the Government took several proactive steps for increasing the growth of OTR since 2006-07. By 2010-11, Revenue Deficit (RD) (in other words borrowing for financing current expenditure) as a proportion of the borrowings in the financial year, which is called Fiscal Deficit (FD) came down, when compared to the previous five year period. The Details are given below:
.jpg)
However, this trend in revenue led fiscal consolidation, which is evident from the reduction in all deficit indicators could not be sustained during the period since 2011-12. The details are given here.
.jpg)
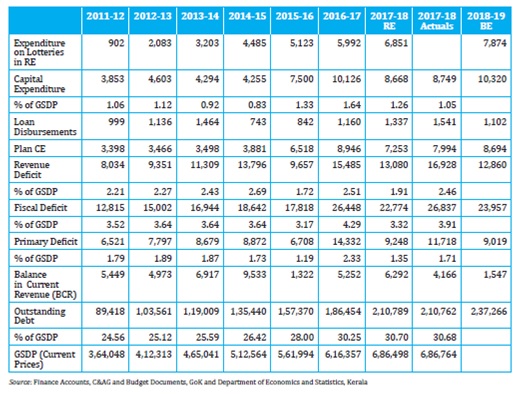
Capital Expenditure: The consistent efforts to provide adequate funds for creation of capital assets have been apparent since 2007-08. The capital outlay of ` 902.58 crore in 2006-07 rose to ` 1474.58 crore in 2007-08. The trend of enhanced level of capital outlay continued in subsequent years also. The capital outlay increased to ` 3363.69 crore in 2010-11 from ` 2059.38 crore in 2009-10. The ratio of capital outlay to GSDP that stood below 1% in some of the preceeding years advanced to 1.27% in 2010-11. The capital expenditure estimated for 2011-12 is ` 5063.82 crore, its ratio to GSDP being 1.55%. Public works continued to remain the major segment of capital outlay. Details of capital expenditure and total expenditure from 2005-06 to 2011-12 (BE) is shown here
During 2010-11, the commitments on three major items coming under non-plan/non-developmental expenditure, viz, interest, pension and salary accounted for about 72.68% of the total revenue receipt of the state whereas it was 75.83% in 2009-10. The rate of growth in interest payment during 2010-11 over the previous year was 7.50%. Expenditure as salary during the period went up by 12.94%. As against 2009-10, Expenditure on pension during 2010-11 went up by ` 1061.99 crore. The total Expenditure on interest, pension and salary which was 80.19% of the revenue receipts and 66.57% of revenue expenditure in 2005-06 reached at a level of 72.68% of revenue receipts and 64.98% of revenue expenditure in 2010-11.
Tables showing expenditure pattern
The capital expenditure, which is the total of capital outlay and loans and disbursements by the Government. It is to be noted that, the Kerala Infrastructure Investment Board (KIIFB) gives approval for capital expenditure, which is not reflected below:
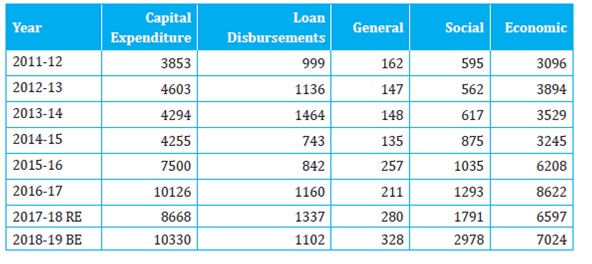
Components of capital expenditure, in ₹ crore
The share of capital expenditure has been around 9 per cent of the total expenditure. At present, around 57 per cent of borrowed funds is utilised for revenue expenditure (2018-19 BE).If the process of fiscal consolidation aiming at higher growth in revenues and rationalisation of revenue expenditure is successful; a higher share of borrowings in the financial year can be used for capital expenditure. The details are shown below:
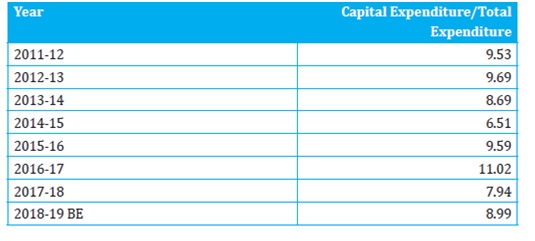
Share of capital expenditure in total expenditure, in per cent
Source: Central Statistical Organization and Department of Economics and Statistics, E.R.2008-2018