Envis Centre, Ministry of Environment & Forest, Govt. of India
Printed Date: Wednesday, April 24, 2024
Economics
Global Economic Scenario and National Outlook
The short-term economic forecast from the World Economic Situation and Prospects 2023 of United Nations predicts an imminent global economic downturn due to rising inflation, aggressive monetary tightening, and increased uncertainty.
The World Economic Outlook of International Monetary Fund, October 2023 forecasts that the global growth is to slow from 3.5 per cent in 2022 to 3.0 per cent in 2023 and 2.9 per cent in 2024. Global inflation is forecast to decline steadily, from 8.7 per cent in 2022 to 6.9 per cent in 2023 and 5.8 per cent in 2024. Emerging market and developing economies are projected to have growth modestly decline, from 4.1 per cent in 2022 to 4.0 per cent in both 2023 and 2024, Global Economic Prospects, June 2023 of World Bank reiterates same.
The UN statistics predicts that average GDP growth in India would moderate from 6.4 per cent in 2022 to 5.8 per cent in 2023, as higher interest rates and a global slowdown weigh on investment and exports. The World Economic Outlook of International Monetary Fund projected that the growth in India is to remain strong, at 6.3 per cent in both 2023 and 2024, with an upward revision of 0.2 percentage point for 2023, reflecting stronger than-expected consumption during April-June.
The UN forecast a safe position for inflation levels in India at 7.1 per cent in 2022, and it is expected to decelerate to 5.5 per cent in 2023 as global commodity prices moderate and slower currency depreciation eases imported inflation.
National Income
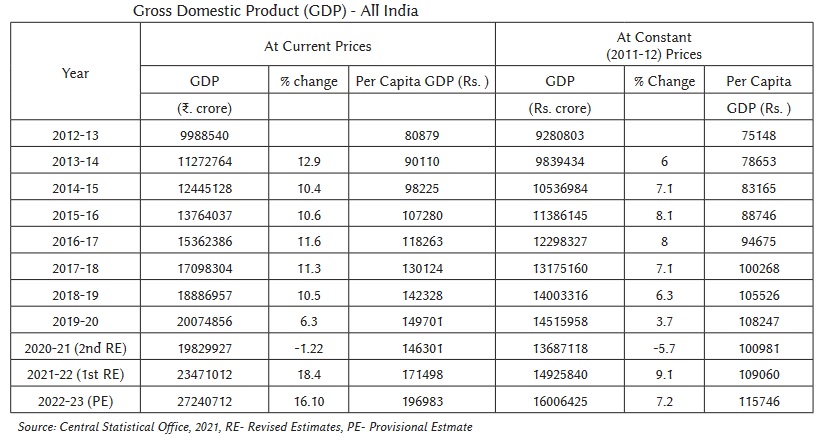
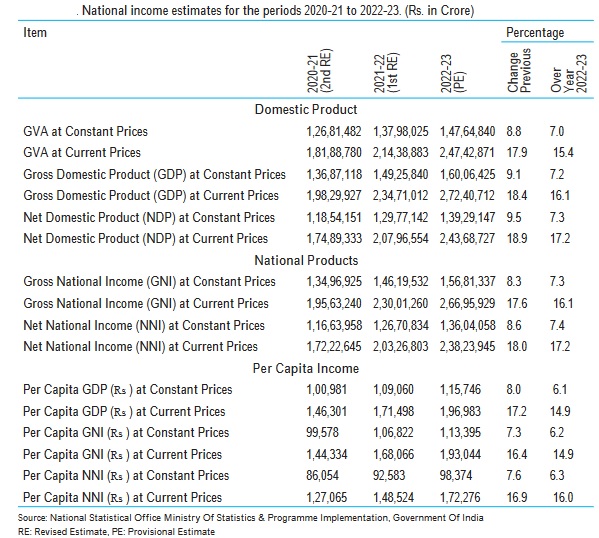
The provisional estimate of Gross Domestic Product in 2022-23, at constant prices is Rs 1,60,06,425 crore registering a growth of 7.2 per cent over previous year. This is around two points less than the GDP growth rate for 2021-22, which was 9.1 per cent. Gross Value Added for 2022-23, however shows 7 per cent growth, against 8.8 per cent for 2021-22. The per capita GDP for 202223 is Rs.1,15,746 with a 6.1 per cent growth over the previous year. The details of national income estimates are shown below:
.jpg)
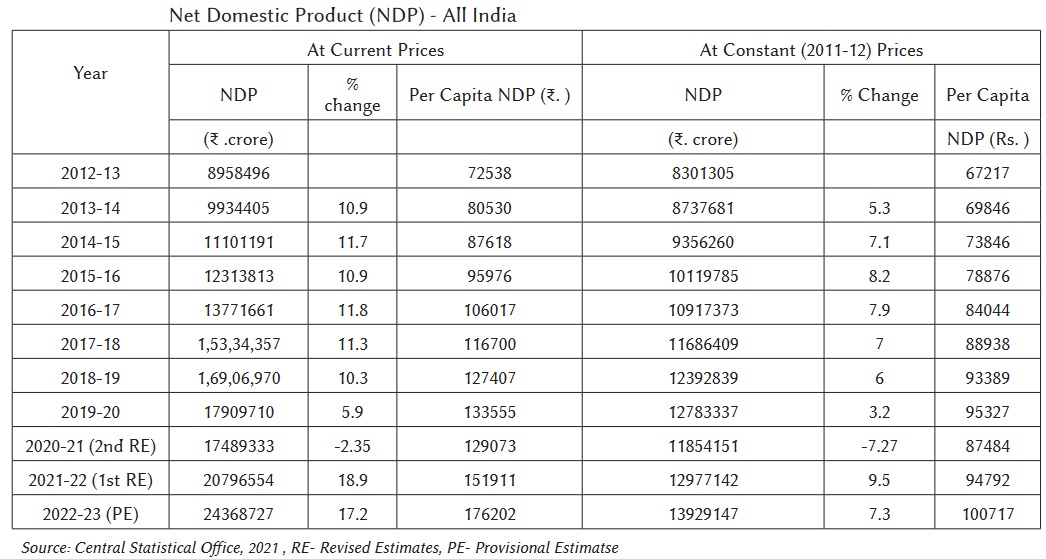
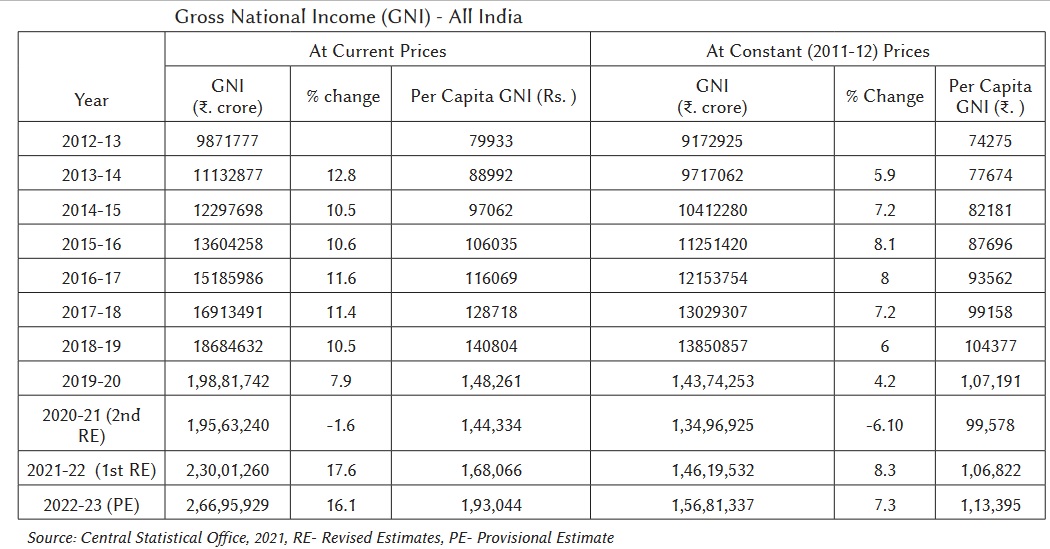
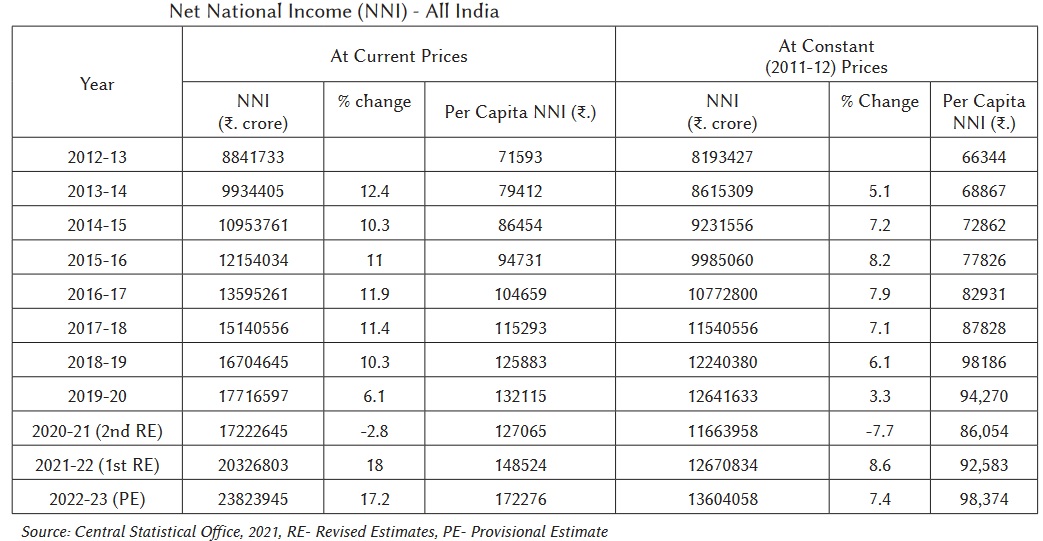
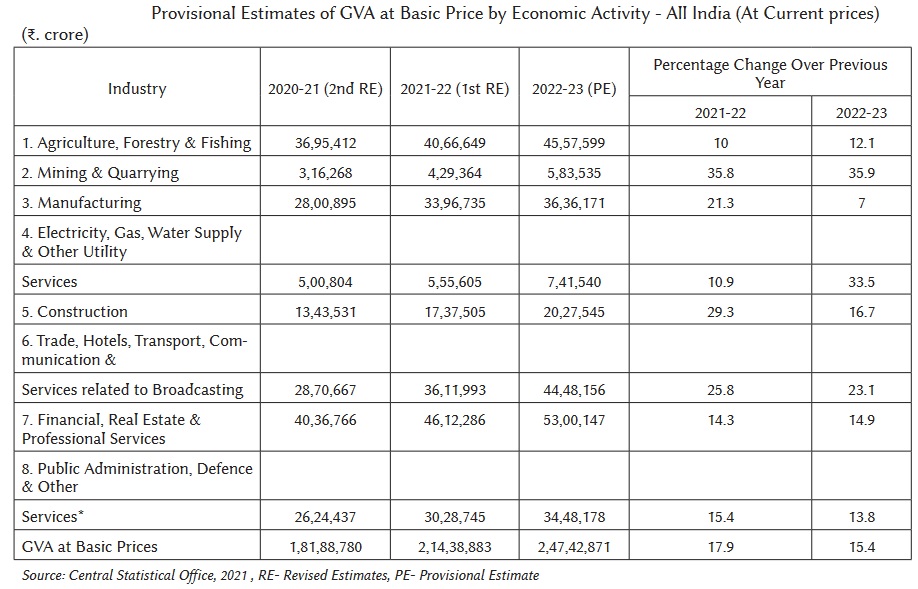
The growth in GVA at current prices for 2022-23 is 15.4 per cent, and it is 7 per cent at constant prices. In absolute terms GVA at current prices was Rs. 2,47,42,871 crore for 2022-23. Similarly, GDP at current prices grew by 16.1 per cent against 7.2 per cent at constant prices. The growth figures of GVA and GDP at current prices for 2022-23 was lower than that of the previous year by two per cent points. The details of India’s GDP, NDP, GNI and NNI at current and constant (2011-12) prices from 2012-13 to 2022-23 with percentage change over the previous year are given below:
The sectorial distribution of GVA at constant and current pricess are given below:
.jpg)
State Income
As per the quick estimates, the Gross State Domestic Product (GSDP) for Kerala during 2022-23 at constant prices of 2011-12 is Rs 6,16,18,850 lakh. The Gross State Value Added (GSVA) for the same period at constant prices is Rs 5,32,68,632 lakh, and the per capita GSDP is Rs 1,74,214. Details are given in below:
The GSDP growth rate for 2022-23 at constant prices was 6.6 per cent, which was 12.97 per cent in 2021-22. The GSVA growth at constant prices for the same period was 6.19 per cent, and that was 12.74 per cent during 2021-22.
Per Capita State Income
Kerala is among the top ten States of India in terms of per-capita Gross State Domestic Product. Kerala’s per-capita GSDP was Rs 1,74,214 in 2022-23; the corresponding national average was Rs 1,15,746. In other words, average income per person in Kerala was 1.5 times the Indian average in 2022-23.
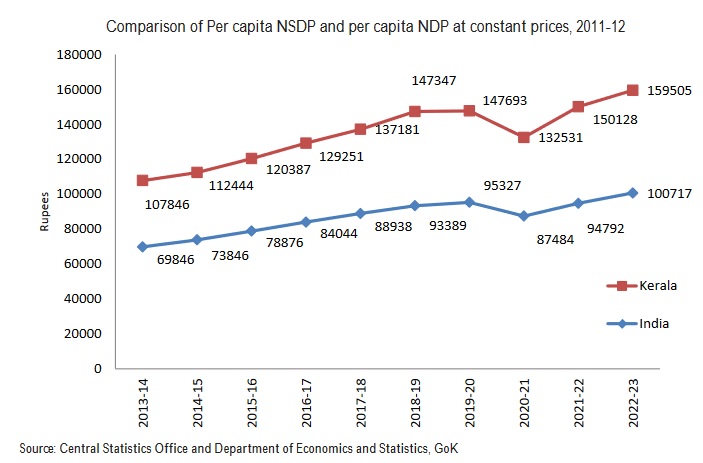
Per capita NSDP for Kerala was 1,59,505 at constant prices, and 2,63,945 at current prices during 2022-23 (Quick estimate). The growth of per capita NSDP at constant prices was 6.25 per cent and it was 12.59 per cent at current prices. The figure below plots per capita NDP and NSDP between 2013-14 and 2022-23 at constant prices. Per capita NSDP for Kerala was higher than the per capita NDP for all India-level, for all the years of comparison.
Sectorial Composition
The quick estimates of 2022-23 shows that the service sector continues to drive the State economy by contributing 62.62 percentage of GSVA during 2022-23, followed by industry and agriculture. The details of sector wise GSVA distribution was presented in the table below:
.jpg)
The composition of items as per the quick estimates shows that agriculture and allied activities constituted 8.52 percentage of GSVA during 2022-23. Construction was the biggest component of the secondary sector accounting for 13.79 per cent of GSVA during 2022-23. In tertiary and real estate, ownership of dwelling & professional services constitute the biggest group, accounting for 16.96 percentages in tertiary sector. Manufacturing, trade and repair services, Transport, storage, communication and services related to broadcasting, and financial services were also major contributors of the State economy. The figure below depicts the trends in GSVA in basic sectors of state economy from 2019-20 to 2022-23.
.jpg)
There was a spectacular recovery for all the sectors during 2021-22 following the COVID-19 shock. In 2020-21, GSVA of service sector declined by 15.18 per cent but there was a turnaround and growth of 16.74 per cent in 2021-22. In the case of agriculture, growth rates were always and pace of growth in 2022-23 was similar to that in the previous year. The industry sector exhibited a strong recovery with growth rate of 7.26 per cent during 2021-22, which rose further to 7.72 per cent in 2022-23.
The details of the sectoral distribution are given in Table 1 and Table 2 GSDP with percentage change over the previous years for the last four years is given here . Details of GSVA, NSVA at constant and current prices during 2011-12 to 2022-23 are given at Table 1 , Table 2 , Table 3 , and Table 4.
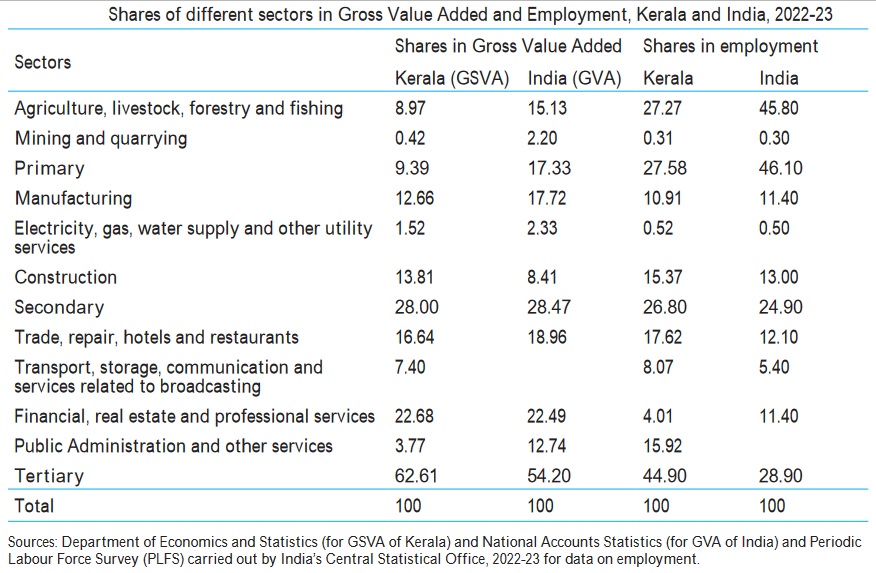
Sector-wise Distribution of Value Added and Employment
The structure of the economy and workforce participation in Kerala is perceptibly different from the rest of India. The share of agriculture and allied activities in GVA is 15.13 per cent for agriculture and allied activities. But it employs 45.80 per cent of the work force during 202223, in India. However, in Kerala, there has been a large-scale withdrawal of workers from agriculture over the years, so that its share in total workforce participation is 27.27 per cent only in 2022-23 and which contributes 8.97 per cent of GSVA during 2022-23. The manufacturing sector contributes 12.66 per cent GSVA in Kerala and absorbs 10.91 per cent of work force. All India level, the sector employs 11.40 per cent of the work force and contribute only 17.72 per cent of the GVA.
District-wise GSVA
District-wise distribution of GSVA at current prices shows that Ernakulum continues to have the highest income of Rs 1,20,50,520 lakh in 202223 as against Rs 1,07,42,614 lakh in 2021-22, registered a growth of 12.17 per cent. The Gross District Value Added of all the districts is given below:
.jpg)
District-wise Per Capita Income (GSVA)
The analysis of District-wise per capita income indicates that Ernakulum continues to stand first with the per capita income of Rs 2,02,863 at constant (2011-12) prices in 2022-23 as against Rs 1,91,613 in 2021-22. The per capita gross district value added with corresponding rank and growth rate is given below:
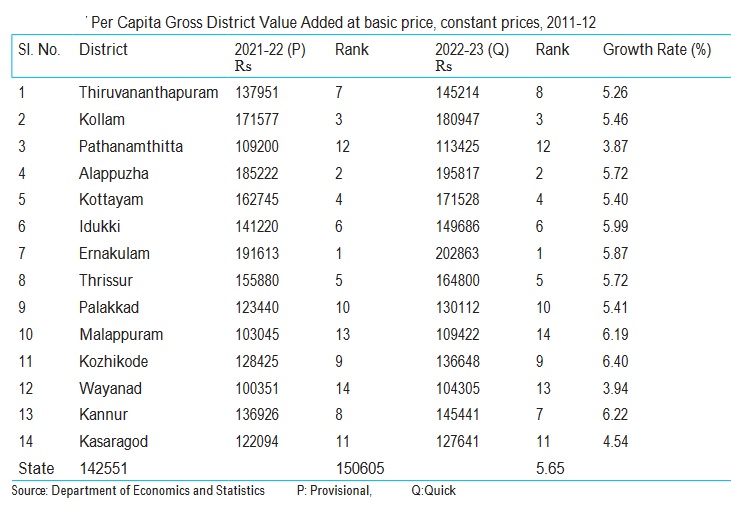
Highest growth rate of per capita GDVA is recorded as 6.40 per cent in Kozhikode District and lowest growth rate recorded in Pathanamthitta District at 3.87 per cent. District-wise and sectoral distribution of GSVA from 2020-21 to 2022-23 at current and constant (2011-12) prices are given in Appendix 1.1.14, 1.1.15 , 1.1.16 , 1.1.17 , 1.1.18 and 1.1.19.
Expenditure Pattern:
Expenditure of State includes three components viz. revenue expenditure, capital expenditure and expenditure on loan disbursements. The total expenditure in nominal terms increased from Rs 66,244.01 crore in 2013-14 to Rs 1,58,738.43 crore in 2022-23, recording a CAGR of 10.20 per cent. Out of the total expenditure , in 202223, Non-Plan and Plan expenditure stood at Rs 1,25,988.45 crore (79.37 per cent) and Rs 32,749.98 crore (20.63 per cent) respectively.
Revenue Expenditure:
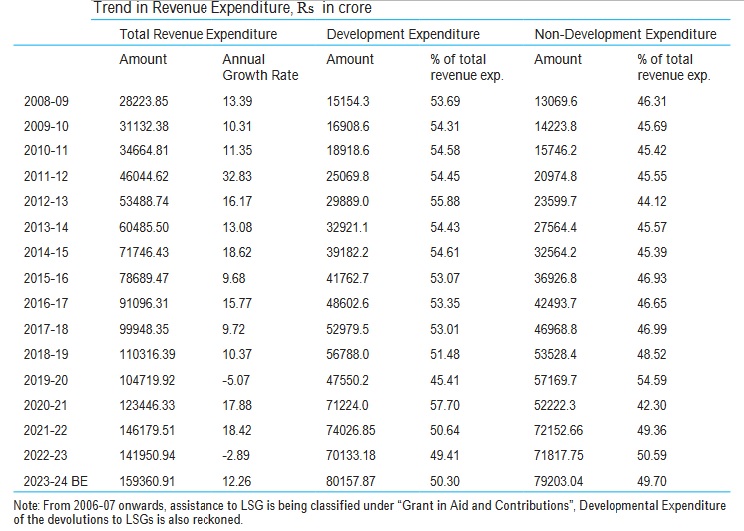
Revenue expenditure involves both development and non-development expenditure. Development expenditure includes expenditure on Education, Health, Agriculture and Animal Husbandry, Industries, Labour and Employment. Nondevelopment expenditure comprises interest payment, pension payment, debt charges, administrative services and others. Details of revenue expenditure are given in the table below:
The operational and maintenance cost for the completed projects and programmes are also classified under the revenue account. Grants provided by the State to meet salaries and pension liabilities of employees in the Universities and State autonomous bodies and also the pension liabilities of employees of Panchayat Raj Institutions are classified as revenue expenditure. Major portion of revenue expenditure devolved to the Local Self Government Institutes is utilised for the creation of capital assets at the local government level.
The operational and maintenance cost for the completed projects and programmes are also classified under the revenue account. Grants provided by the State to meet salaries and pension liabilities of employees in the Universities and State autonomous bodies and also the pension liabilities of employees of Panchayat Raj Institutions are classified as revenue expenditure. Major portion of revenue expenditure devolved to the Local Self Government Institutes is utilised for the creation of capital assets at the local government level.
In 2022-23, the share of committed expenditure in revenue expenditure increased compared to the previous year. Expenditure on committed liabilities on salaries, pension, interest payments, subsidies and devolution to the LSGIs constituted 71.54 per cent of revenue expenditure. In 202223, salary and pension as per cent of total revenue expenditure decreased to 45.08 per cent from 48.84 per cent in 2021-22. Interest payment as per cent of total revenue expenditure was 17.74 per cent in 2022-23 compared to 15.94 per cent in 2021-22. Details of Revenue expenditure are given in the Appendix 1.5.4 and 1.5.5
Capital Expenditure:
As most of State expenditure on Human Capital is categorised as revenue expenditure, the outlay in capital expenditure has always been small. Still, the Government of Kerala is committed to infrastructural development in the State and has initiated innovative financing models to support major infrastructural projects for the sustainable development of the State economy. These models have already begun to show positive results by attracting long term investment in capital projects. Details of capital expenditure and total expenditure are given here.
The share of government spending on capital projects in various sectors has increased in recent years. The capital expenditure of the State in 2022-23 was Rs 16,787.49 crore. Public Works continued to remain the major segment of capital outlay with 19.38 per cent of the total capital outlay in 2022-23 followed by, Agriculture and allied activities (5.44 per cent), Industries and Labour (3.78 per cent), and Irrigation (2.88 per cent). The trend in capital outlay is given here.
Source: Central Statistical Organization and Department of Economic & Statistics,
E.R 2008-23, Department of Economics and Statistics, Government of Kerala