Envis Centre, Ministry of Environment & Forest, Govt. of India
Printed Date: Tuesday, April 23, 2024
Energy
Energy Development
Energy is an essential input for economic development and improving the quality of life. Development of conventional forms of energy for meeting the growing needs of society at a reasonable cost is the responsibility of the Government Development and promotion of non-conventional /alternative/ new and renewable sources of energy such as solar, wind and bio energy etc are getting sustained attention. Nuclear energy development being geared up to contribute significantly to the overall energy availability in the country.
Universal access to affordable power in a sustainable manner is the guiding principle for the Power sector. Sources of power in India range from conventional sources to viable non-conventional sources. Almost 80 per cent of India’s energy requirements are met by coal, oil, natural gas and solid biomass (Source: International Energy Agency). India’s per capita emission is quite low but in absolute terms, it is the 3rd largest greenhouse gas emitter (country-wise) in the world. Per Capita Electricity Consumption of India in general and Kerala in particular is much below the world average.
India is ranked 63rd in the World Energy Trilemma Index (WETI) 2022, which annually measures the energy system performance of 127 countries based on Energy Security, Energy Equity, Environmental Sustainability and Country Context Dimension. India is one of the countries that occupies the centre stage in the world’s quest for clean energy transition and mitigation of climate change, and ranked 8th as a high-performing country in the Climate Change Performance Index (CCPI 2023).
Power Sector - Indian Scenario
The national grid has an installed capacity of 4,03,759 MW as on June 30, 2022. In India, electricity from thermal energy is the dominant source of power. It constitutes nearly 58 per cent of the total installed capacity in the country as on June 30, 2022. Contribution of electricity generation from different sources to the national grid is given in Table 11.2.1. Of late, renewable sources have emerged as the second largest electricity source in the country relegating hydroelectric power to the third position.
Installed Capacity (MW) in India 2021-22
|
Fuel
|
Installed Capacity (MW)
|
|
As on March 31, 2022
|
%
|
As on June 30, 2022
|
%
|
|
Thermal
|
2,36,108.72
|
59.10
|
2,36,065
|
58.46
|
|
Hydro
|
46,722.52
|
11.69
|
46,850
|
11.60
|
|
Nuclear
|
6,780.00
|
1.69
|
6,780
|
1.67
|
|
Renewable Sources
|
1,09,885.38
|
27.50
|
1,14,064
|
28.25
|
|
Total
|
3,99,496.62
|
|
4,03,759.00
|
|
|
Source: Central Electricity Authority (CEA)
|
In the sector-wise breakup of total energy generation as given in below as on June 30, 2022, the contribution of the State sector is 1,04,969 MW (25.99 per cent), Central sector 99,005 MW (24.52 per cent) and private sector 1,99,785 MW (49.48 per cent).
Installed Capacity (MW) in India 2021-22, Sector-wise
|
Sector
|
Installed Capacity (MW)
|
|
As on March 31, 2022
|
%
|
As on June 30, 2022
|
%
|
|
Central Sector
|
99,004.93
|
24.78
|
99,005
|
24.52
|
|
State Sector
|
1,04,854.98
|
26.24
|
1,04,969
|
25.99
|
|
Private Sector
|
1,95,636.71
|
48.97
|
1,99,785
|
49.48
|
|
Total
|
3,99,496.62
|
|
4,03,759
|
|
|
Source: Central Electricity Authority (CEA)
|
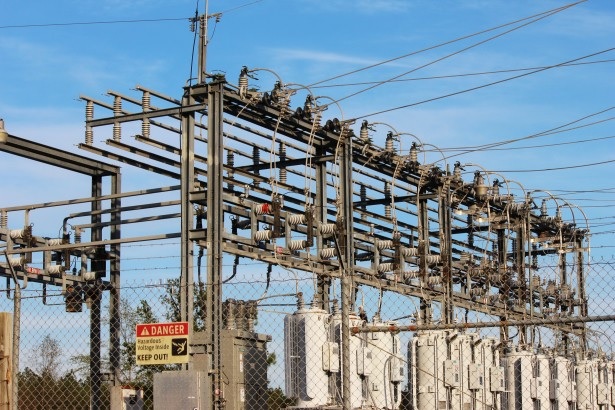
Power Sector in Kerala
Kerala is the second best performing State as per NITI Aayog’s State Energy and Climate Index (SECI) published in 2022, which measures the State’s efforts for improving the energy sector. In Kerala, electricity consumption is predominantly in domestic and commercial sector where as in other states, a major portion of the energy consumption is in industry and agriculture. State is meeting approximately 30 per cent of its present requirement from renewable energy sources. Taukte cyclone during the month of May 2021 severely affected the southern and central districts causing damages to electrical installations, disrupting power in most of the places and about 38 lakh consumers were affected throughout the State. Table below shows the details growth of the power system in the State for the last five years.
Growth of Power System at a Glance during 2017-22
|
Particulars
|
Unit
|
2017-18
|
2018-19
|
2019-20
|
2020-21
|
2021-22
|
|
Installed Capacity
|
MW
|
2975.56
|
3000.35
|
3063.15
|
3029.65
|
3145.82
|
|
Maximum Demand
|
MW
|
3884
|
4242
|
4316
|
4284
|
4380.04
|
|
Generation per annum
|
MU
|
5474.47
|
7593.12
|
5722.81
|
7057.90
|
9742.29
|
|
Annual Sales
|
MU
|
21159.19
|
21750.25
|
23058.91
|
22540.30
|
23983.42
|
|
Per capita consumption
|
kWh
|
613
|
626
|
657
|
619
|
676
|
|
Export per annum
|
MU
|
166.89
|
1030.20
|
323.84
|
633.39
|
2244.73
|
|
Import per annum
|
MU
|
18677.46
|
17982.15
|
20827.12
|
18708.40
|
19156.36
|
|
Consumers
|
Nos (lakh)
|
122.76
|
125.52
|
128.26
|
131.43
|
134.22
|
|
Street Lights
|
Nos.
|
1417639
|
1422764
|
1447820
|
1476776
|
2301556
|
|
E-vehicle Charging stations
|
Nos.
|
|
|
8
|
56
|
219
|
|
Total revenue per annum
|
₹ in crore
|
12260.00
|
14002.94
|
14718.59
|
15169.39
|
15664.92
|
|
Source: KSEBL
|
Power Availability:
The quantum of power available in the State is met from Central Stations, private generators, Power Exchanges and also from internal sources including stations owned by KSEBL, Independent Power Producers (IPPs), Captive power plants (CPPs), and prosumer. Details are given below:
Energy Sources and Quantum Procured in 2021-22
|
Particulars
|
|
Energy (MU)
|
|
Gross generation KSEBL (excluding auxiliary consumption)
|
A
|
9763.05
|
|
Power purchase from CGS at Kerala periphery
|
B
|
9505.47
|
|
Power purchase through long term/medium term/short term contracts/swap at Kerala periphery
|
C
|
8628.08
|
|
Total Power purchase from IPPs/CPPs inside the State
|
D
|
753.74
|
|
Total power purchase at Kerala periphery [ Row 2+3+4]
|
E = B + C + D
|
18887.67
|
|
Energy injected by Private IPPs at generated end for sale outside the State through open access
|
F
|
49.28
|
|
Energy availed through open access at Kerala Periphery
|
G
|
268.69
|
|
Auxiliary consumption
|
H
|
20.77
|
|
EXPORT-Energy sales by KSEBL, SWAP Return by KSEBL and Energy injected by Private IPP’s at KSEB periphery for sale outside the State through open access
|
I
|
2244.73
|
|
Total energy input to Kerala periphery for meeting the consumption of the State including energy wheeled through open access
|
J = A + E + F + G – H – I
|
26703.19
|
|
Source: KSEBL
|
Power Demand:
Peak demand of the State in 2021-22 was 4,380.04 MW (on March 17, 2022), indicating 2.24 per cent increase from 4,284 MW in 2020-21. Morning peak demand was 3500 MW, Average demand was 3,337.44 MW and average day demand was 2,885.40 MW for 2021-22. The below figure shows the energy requirement and maximum demand for energy during the last five years.
Requirement and Maximum Demand for Energy during the Last Five Years
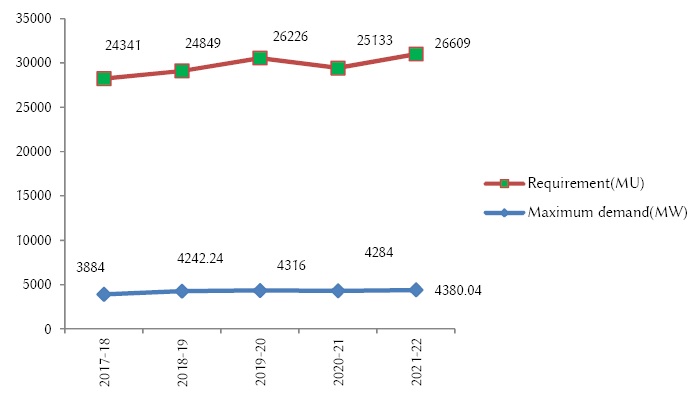
Source: KSEBL
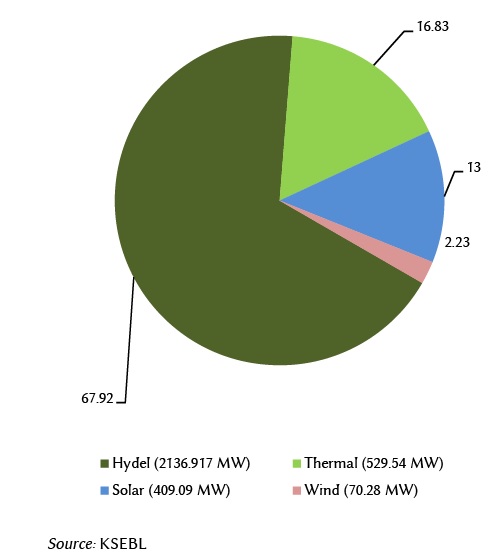
Generation
Total installed capacity of power in the State as on March 2022 is 3,145.82 MW, of which, hydel power contributed the major share of 2,136.91 MW (67.92 per cent); while 529.54 MW was contributed by thermal projects (16.83 per cent), 409.09 MW (13 per cent) from solar and 70.28 MW from wind (2.23 per cent).
(Appendix 11.2.3) Energy Source in Kerala from 2017-2022 (MW)
|
Source of Energy
|
2017-18
|
2018-19
|
2019-20
|
2020-21
|
2021-22
|
|
Hydel: KSEB
|
2055.76
|
2058.76
|
2058.76
|
2058.76
|
2066.20
|
|
Thermal: KSEB
|
159.96
|
159.96
|
159.96
|
159.96
|
159.96
|
|
Wind: KSEB
|
2.03
|
2.03
|
2.03
|
2.03
|
2.03
|
|
Solar: KSEB
|
14.85
|
16.85
|
17.47
|
17.51
|
30.28
|
|
Solar other than
KSEBL
(solar connected
to Grid other
than KSEBL)*
|
97.48
|
117.27
|
169.43
|
180.85
|
276.81
|
|
Solar :IPP
|
|
|
|
102.00
|
102.00
|
|
NTPC(Thermal
IPP)
|
359.58
|
359.58
|
359.58
|
359.58
|
359.58
|
|
Thermal: CPP
|
157.00
|
157.00
|
167.00
|
10.00
|
10.00
|
|
Hydel: CPP
|
33.00
|
33.00
|
33.00
|
33.00
|
33.00
|
|
Hydel: IPP
|
37.66
|
37.66
|
37.66
|
37.71
|
37.71
|
|
Wind: IPP
|
58.25
|
58.25
|
58.25
|
58.25
|
58.25
|
|
Wind:CPP
|
|
|
10.00
|
10.00
|
10.00
|
|
Total
|
2975.570
|
3000.36
|
3073.14
|
3029.65
|
3145.82
|
|
Source : KSEBL, * Solar other than KSEBL value includes solar prosumers (on grid consumers)
|
(Appendix 11.2.4) Total Installed Capacity in Kerala from 2017-2022
|
Sector
|
2017-18
|
2018-19
|
2019-20
|
2020-21
|
2021-22
|
|
State Sector
|
2232.60
|
2237.60
|
2238.22
|
2238.26
|
2258.47
|
|
Central Sector
|
359.58
|
359.58
|
359.58
|
359.58
|
359.58
|
|
Private Sector
|
383.38
|
403.18
|
475.34
|
431.81
|
527.77
|
|
Total
|
2975.56
|
3000.36
|
3073.14
|
3029.65
|
3145.82
|
|
Source : KSEBL
|
Appendix 11.2.3 highlights the details of energy source and its installed capacity during the last five years while sector-wise details are presented in Appendix 11.2.4. Of the total installed capacity of 3145.82 MW in 2021-22, the contribution of State sector is 2258.47 MW (71.97 per cent), Central sector 359.58 MW (11.40 per cent), and private sector 527.77 MW (16.77 per cent). The figure below shows the total installed capacity of Kerala from hydel, thermal, and renewable sources.
Total installed capacity of Kerala in 2021-22 in Percent
Transmission
Kerala has 434 transmission substations, with 14,837 circuit km lines, and 24,911.50 MVA transformation capacity. Of these, 428 substations are owned and operated by KSEBL. A total of 8 transmission substations and 1,106.78 ckt. km lines were commissioned in 2021-22. Kerala’s transmission infrastructure consisting of substations, targets and achievements and network details as on March 31, 2022 are given below:
|
Transmission Infrastructure in Kerala (as on 31.03.2022)
|
|
Sl. No
|
Capacity
|
Substations Nos.
|
Lines in ckt.km
|
|
1
|
400 kV
|
1+6*
|
1330.00
|
|
2
|
220 kV
|
29
|
3353.00
|
|
3
|
110 kV
|
177
|
5795
|
|
4
|
66 kV
|
60
|
1971
|
|
5
|
33 kV
|
161
|
2388
|
|
|
Total
|
434
|
14837.00
|
|
Source: KSEBL, *6 nos.& 1152.97 ckm 400kV line owned by PGCIL
|
|
Transmission Infrastructure (2021-22)-Target & Achievement (Unit in Nos.)
|
|
Sl. No
|
Item
|
Target
|
Achievement
|
% of Achievement
|
|
1
|
220 kV Substations
|
6
|
2
|
33.33
|
|
2
|
110 kV Substations
|
20
|
5
|
25.00
|
|
4
|
33kV Substations
|
1
|
1
|
100.00
|
|
Source: KSEBL
|
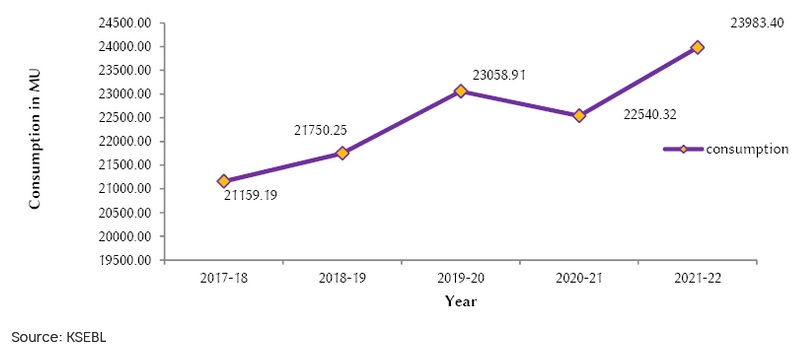
Pattern of Power Consumption:
The electrical energy consumption in the State has increased to 23,983.42 MU (includes open access consumption) in 2021-22 from 22,540.32 MU in 2020-21, an increase of 6.40 per cent. Electrical energy consumption in Kerala from 2017-18 to 2021-22 is depicted in Figure 11.2.2. The total number of consumers as on March 31, 2022 was 1,34,22,642. In Kerala, the electricity consumption is predominantly in domestic (76.34 per cent) and commercial (12.34 per cent) sector where as in other states, a major portion of the energy consumption is in industry and agriculture. KSEB has sold 23,499.59 MU power within the State, which includes own consumers and also sale to other bulk licensees. An amount of ₹15,766.34 crore was collected as revenue from the sale of power in 2021-22.
Electrical Energy Consumption in Kerala during 2017-18 to 2021-22
Distribution:
The distribution network as on March 31, 2022 has 66,486 circuit km of 11kV lines, 3,00,439 circuit km of LT lines, and 85,594 distribution transformers with step down capacity of 10,448 MVA. There are 12 Distribution Licensees in Kerala, of which the State DISCOM is KSEBL, and 8 licensees procure power from KSEBL for distributing within their areas of distribution. KSEBL services more than 99 per cent of the total electricity consumers in the State.